XGDB
Synopsis
xgdb [options] xe-file
xgdb [options] --args xe-file arg1 arg2 .. argn
Description
XGDB is an extended version of the open-source GDB debugger. The extensions allow XGDB to debug multi-tile XCore applications in the form of XE files.
XGDB communicates with the target via XGDBSERVER, which is able to attach to multiple types of target including:
Real hardware via an xTAG debug adapter
Simulated hardware provided by XSIM
XGDBSERVER can be started from within the XGDB environment using either the connect or attach command.
Most documentation about use of XGDB can be found from the GDB documentation; this page largely only documents where XGDB extends or differs from GDB.
For a quick-start guide on how to use the tool, see Debugging with XGDB.
Concepts
XGDB uses many features of GDB that may not be familiar, in particular the “multi-inferior” feature, which allows simultaneous debugging of multiple tiles. This section aims to give an overview of these concepts and some more advanced topics.
Inferiors & threads
In an XMOS system, there are multiple tiles, which are independent processors with their own independent memory and address space. Each of these tiles contains multiple hardware threads (logical cores), which all share the same memory and other resources on the tile they belong to.
In GDB, each tile is represented as a unique “inferior”. An inferior in GDB is a program which runs in
its own context and address space. Inferior numbers start at 1 and increment by 1 for each new inferior. You can switch
between different inferiors using the inferior or tile command (inferior is a standard GDB command,
tile is an XMOS extension).
Note that there is no particular mapping between a tile ID and the inferior number. The tile ID is a property of the hardware system - each tile has a unique ID. XGDB assigns an incrementing, unique inferior number to each new inferior it sees. Also noteworthy is that tile IDs start at zero, whereas inferior numbers start at 1. This leads to the situation that usually tile[0] is inferior 1, tile[1] is inferior 2, etc.
All inferiors in the system can be listed using the info inferiors command.
Each logical core in a system is represented by a thread in GDB. Threads in GDB belong to an inferior,
and their thread ID represents this. For instance, the first thread of inferior 1 will have thread id 1.1.
The third thread of inferior 2 will have thread id 2.3.
You can switch between different threads in the system using the thread command. Again, there
is no guaranteed correspondence between the thread id in GDB and the logical core index on the hardware,
but usually tile[0] core[0] is thread 1.1, tile[0] core[1] is thread 1.2, etc.
All threads in the system can be listed using the info threads command.
Targets, connections and XGDBSERVER
The ‘target’ is the platform on which the program runs. In the case of XGDB, the target is usually either actual hardware, or the XSIM simulator. XGDB connects to the target by using the ‘remote’ target connection mechanism to XGDBSERVER, using a well-defined protocol over a TCP pipe between the 2 programs.
The ‘target program’ is the program which is running on the target.
XGDBSERVER then handles actually connecting to the hardware, or starting up the simulator, so that GDB has a target to control. You may recognise this pattern from other ecosystems which use other gdbserver implementations such as OpenOCD.
XGDB provides helper commands connect and attach, which start up an instance
of XGDBSERVER as a child process, then immediately connect to it. This is very convenient for connecting
to a target which is plugged into the same host PC, or quickly starting the simulator.
For more advanced situations, it may be more desirable to run XGDB and XGDBSERVER separately, such as:
Running XGDBSERVER in a separate terminal window, so the program output is separate from the XGDB interface.
Connecting to a target board via an xTAG which is plugged in to a different host machine.
Note that all system calls, including print messages are handled by XGDBSERVER. This means, for example, that if the target program creates a file, that file will be created on the system running XGDBSERVER, relative to the working directory of the XGDBSERVER program.
If running XGDBSERVER separately, you must specify the TCP port XGDBSERVER should host the server at using the
xgdbserver --port option. Then XGDB can be used to connect to that server using the target remote command.
If using the connect or attach command, note that XGDBSERVER is started as a subprocess,
so care must be taken when forcefully killing it. If using SIGKILL on XGDB, for instance, it may take some
additional time for XGDBSERVER to notice that it has shut down and clean up after itself. Using SIGTERM (on POSIX) or
quit allows XGDB to properly clean up after itself before terminating. This also applies to cleaning
up temporary files.
TUI as an visual interface
XGDB includes a text user interface (TUI), which provides a more visual, IDE-like experience when debugging target programs.
It can display several different windows, such as “source”, “commands”, “disassembly”, “registers”. Custom windows can also be created: see the official GDB TUI documentation for more information.
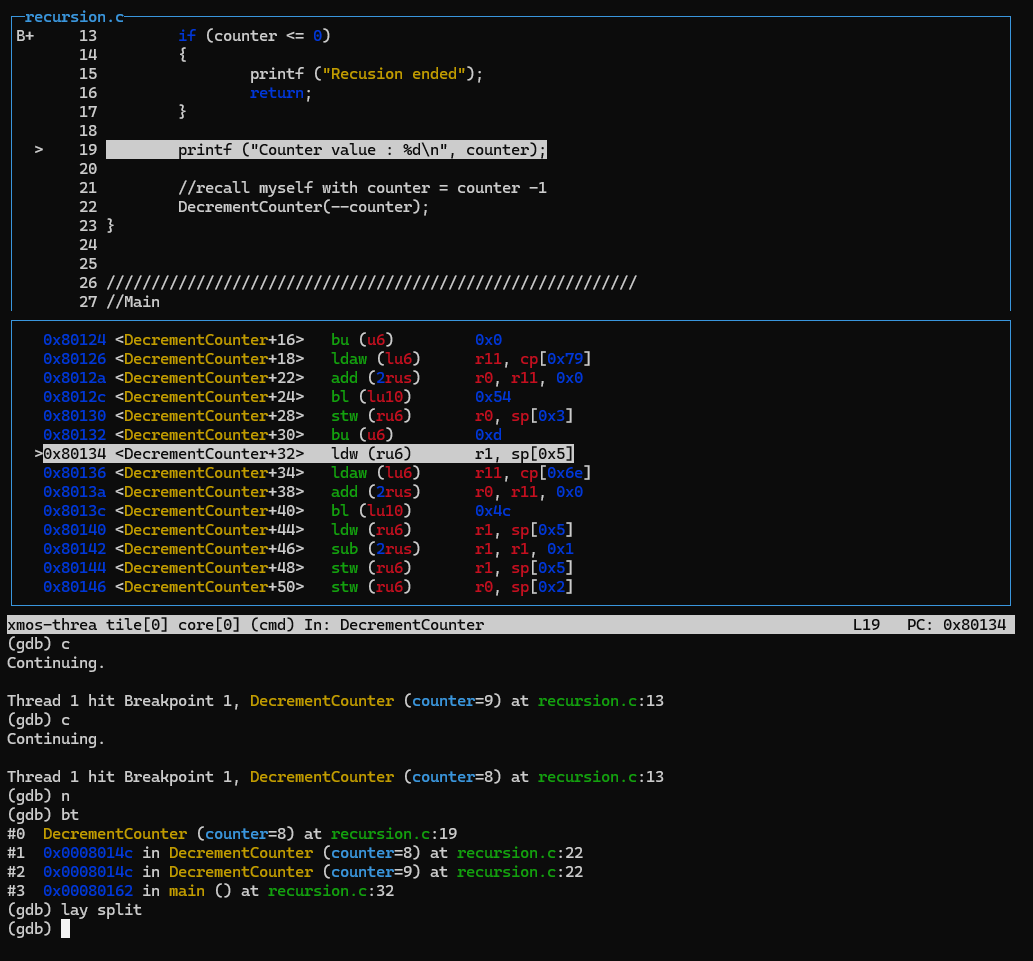
Fig. 24 Example TUI session
To switch focus between different windows, use Ctrl-X followed by O. This allows, for instance,
changing between using the arrow keys to move up and down the source code, and using the arrow keys to scroll
through command history. It is not currently possible to scroll through command output history.
To enable the TUI, you can use the tui enable command. Or the layout src/layout split commands
can be used to simultaneously enable the TUI and jump into a specific layout.
To disable the TUI and return to normal GDB, you can use tui disable.
Sometimes to prompt GDB to actually print the source of the current location, it may be necessary to use the list
command, or select a stack frame for which the source is actually available. For instance, this may happen if GDB does not have
debug line information for the current program counter.
Note
On Windows, GDB does not automatically resize when the terminal is resized. Use Ctrl-L to refresh the
screen and resize to the correct dimensions. This will also clear any other non-TUI output that has been written
to the terminal.
Using XGDB in scripts
XGDB is primarily a tool for interactive debugging, but it can also be used from scripts in order to run programs and debug them according to a script. See the following section for guidance on how to script XGDB itself.
When using XGDB in a script, it is essential to pass the xgdb --batch option. This option means that
XGDB will terminate if the script encounters an error, or once all commands have been executed. It will
also return an error code if it terminates unexpectedly.
The xgdb --return-child-result option is also sometimes useful. This will make XGDB return the exit code
of the target program as its own exit code when it terminates. If the script terminates before the program
is complete, then XGDB will return 1.
The options xgdb -ex and xgdb -x allow commands or command files to be passed to XGDB on the
command line. This allows XGDB to be controlled in a non-interactive way.
See Scripted debugging for an example.
Scripting GDB
XGDB can be extended and customised. It can be reconfigured to user preference, or expanded with additional commands & functionality as required.
The simplest method of customising XGDB is via the .gdbinit file which can be created in the $HOME
directory. The .gdbinit file will automatically be read and executed every time that XGDB is started.
Some configuration commands that may be desired are:
set confirm off: Disable XGDB prompting for confirmation when running certain commands.set pagination off: Disable XGDB pausing midway for confirmation when printing long command output.define: Define simple procedures which can be run as commands.set history save onandset history size 500: Enable command history to be saved between sessions. This creates a.gdb-historyfile in each directory you start XGDB in.set auto-load local-gdbinitandset auto-load safe-path /: Enable project-specific.gdbinitfiles to be created and automatically run if XGDB is started in the same directory as them.
Note
On Windows, the HOME environment variable is not set by default, so you will need to create and
define a HOME environment variable to a suitable path in order to use a .gdbinit file.
On top of the initialisation files, it is possible to arbitrarily source a command file into the current session using
the source command.
XGDB contains a built-in Python interpreter (Currently Python version 3.8), which can be used for in-process scripting. This enables extensive scripting capability far beyond what is possible just using GDB commands. See the Official GDB documentation for more information, but to summarise, the Python interpreter can be used for many extensions, such as:
Implementing custom commands
Implementing “pretty printers” which nicely print custom datatypes
Implementing custom windows for the TUI
Advanced access to the inferior & target state
Running arbitrary Python scripts
Options
The options for XGDB are the same as for GDB. Only options referenced
by this documentation are described here. To find all the available commands,
use the --help option.
- --args <xe-file> <arg1> <arg2> ... <argn>
Provides an alternative way of supplying the XE file which also allows command line arguments to be passed to a program.
- -ex <command>
Execute given command. If command contains spaces, it should be contained in quotes.
- -x <command file>
Execute all of the commands in the given command file. Lines prepended with
#will be ignored.
- --batch
Run XGDB in a manner more suitable for use in scripts. XGDB will exit after all commands specified on the command line have been run, and return an erroneous exit code if anything fails.
- --return-child-result
Configure XGDB to return the exit code of the target program as its own exit code when it terminates. If the script terminates before the program is complete, then XGDB will return 1. This can be particularly useful when running XGDB from a script.
- --help
List all available command line options
XMOS XGDB commands
The following commands are all provided as part of the XGDB extension to GDB.
Available commands can be listed from within the XGDB environment using either the help
or apropos commands.
For some examples of how to use the commands in practice, see XGDB examples.
Some of these commands are already GDB commands, but have been overridden to work better with
XMOS multi-inferior devices and XE files. This ‘override’ behaviour can be turned off for advanced
use cases, see set cosmetic-command
- listdevices
List and enumerate all xTAG adapters connected to your PC.
- connect
Usage:
connect [<options>...]Connects to a target, resetting it to kill the running program first. If no options are supplied, it will connect to the single xTAG adapter connected to your PC.
This command starts a local instance of XGDBSERVER to interact with the target. For additional options which can be passed to connect, see XGDBSERVER Options, as any arguments to
connectwill be passed to the local instance of XGDBSERVER.Common options:
connect --adapter-idSelect a specific xTAG to connect to. Seelistdevices.connect --xscopeEnable the use of xSCOPE.connect -sConnect to XSIM instead of real hardware.
- attach
Usage:
attach [<options>...]Connects to a target without resetting it - although it is halted and put in debug mode for inspection.
This command is useful in order to debug a program that is already loaded on the device, whereas
connectis more appropriate when loading and running a new program.This command is identical to
connectother than it doesn’t reset the target, so the same XGDBSERVER Options can be passed to it.
- detach
Detach from a target and allow it to continue running, free from the debugger. This will detach every node and every tile in the system, allowing them to continue running without the debugger.
- load
Load the binary (and run any setup ELFs as necessary) but do not start it. This will reset the target.
It is usually more appropriate to use one of
run,startorstarti, which are higher level GDB commands with additional functionality. They all implicitly runloadto re-initialise the target and program.
- starti
Load the binary but halt on the first instruction. This will reset the target.
Any arguments passed to this command will be forwarded to the target program when it is started. A program must be built with
xcc -fcmdline-buffer-bytesin order to support command line arguments.This command is functionally equivalent to
loadif arguments are not passed.
- run
Load the binary and start it. This will reset the target.
Any arguments passed to this command will be forwarded to the target program when it is started. A program must be built with
xcc -fcmdline-buffer-bytesin order to support command line arguments.
- start
Load the binary and start it, halting at the start of main. This will reset the target.
Any arguments passed to this command will be forwarded to the target program when it is started. A program must be built with
xcc -fcmdline-buffer-bytesin order to support command line arguments.
- tile
Usage:
tile <tile number>Change the focus of subsequent commands to tile
<tile number>. This is an alternative to the default GDB commandinferior.Running the command with no arguments will print the current inferior description.
- tile apply all
- tiaa
Usage:
tile apply all <command>Apply a command to every tile in the system, in the same spirit as the default GDB
thread apply allcommand. Example:(gdb) tiaa p $pswitch_device_id0 Inferior 1 (tile[0] core[0]): $1 = [ version=0 revision=4 node=0 pid=0 ] Inferior 2 (tile[1] core[0]): $2 = [ version=0 revision=4 node=0 pid=1 ]
This command will work whether or not a target is actually connected (only static analysis is possible when there is no target connected).
- through
Step through a channel operation, halting on the receiving thread on the other side of a channel.
This command causes GDB to continue until it hits an
OUTinstruction on achanend. When it does, it locates the other side of the channel, and halts on it once that thread reaches the correspondingINinstruction.
- monitor
Usage:
monitor <command>Once connected, the
monitorcommand can be used to access XGDBSERVER’s monitor commands. These are typically more advanced/niche commands which interact directly with the target. The commandmonitor helpwill print all the available monitor commands for the current session.
Standard GDB commands
These are documented further in the actual GDB documentation, or by using the help command,
but are included here because they are referenced from this document.
- help
Usage:
help [<command>]Print help information. If a command is specified, then print help information for that command.
- apropos
Usage:
apropos <query>Search all commands for the query, and print the short help page for anything that matches.
- inferior
Usage:
inferior <inferior number>Change the focus of subsequent commands to inferior
<inferior number>. This is an alternative to thetilecommand.Running the command with no arguments will print the current inferior description.
- info inferiors
List the current inferiors in the system, and information about them (such as if they are running). Example:
(gdb) info inferiors
  Num  Description       Connection           Executable
  1    tile[0]           1 (remote :39211)    /tmp/.xgdb/593782/0/MultiNodeBasic.xe.i0_n0_t0.elf
* 2    tile[1]           1 (remote :39211)    /tmp/.xgdb/593782/0/MultiNodeBasic.xe.i1_n0_t1.elf
The
*denotes the current inferior.
- thread
Usage:
thread <thread id>Change the focus of subsequent commands to thread
<thread id>.Running the command with no arguments will print the current thread description.
- info threads
List the current threads in the system, across all inferiors. Example:
(gdb) info threads
  Id   Target Id              Frame
  1.1  tile[0] core[0] (xsim) run (inC=3842, outC=258) at snip.xc:8
  1.2  tile[0] core[1] (xsim) 0x000802a8 in __main__main_tile_0_combined_tile_0_u1 (frame=0xfff24) at snip.xc:30
  1.3  tile[0] core[2] (xsim) 0x000802d2 in __main__main_tile_0_combined_tile_0_u2 (frame=0xfff24) at snip.xc:31
  2.1  tile[1] core[0] (xsim) start (inC=69378, outC=65538) at snip.xc:16
  2.2  tile[1] core[1] (xsim) 0x00080126 in run (inC=66306, outC=66562) at snip.xc:6
* 2.3  tile[1] core[2] (xsim) run (inC=66818, outC=67074) at snip.xc:7
  2.4  tile[1] core[3] (xsim) run (inC=67330, outC=67586) at snip.xc:8
The
*denotes the current thread.
- call
Usage:
call <function expression>The call command can be used to call a function on the current thread on the target. It will set up the program counter to run the function, run it, then restore the previous state and print the result.
Warning
When using this function, it is important to ensure that there is enough stack space for the function to run, as the call command does not check this, and the XTC compilation tools allocate as little space is possible for each thread’s stack. If there is not enough stack space, it will silently overrun the stack, potentially corrupting other data.
- break
Usage:
break <expression> [inferior <num>] [if <condition>]Set a software breakpoint at the location expressed by ‘expression’. An unlimited number of these can be placed, but they can not be placed in ROM code, and will be overwritten if the system boots from flash or uses self-modifying code.
The
ifoption can be used to only halt the system if a certain condition is met.The
inferioroption can be used to only set the breakpoint on a single inferior if it would otherwise be set on multiple.Note that both of these may cause the system to halt momentarily while the condition is evaluated, before being resumed. Realtime behaviour may be broken.
For example:
(gdb) break my_func
(gdb) break *0x80402
- hbreak
Identical to
break, except it uses a hardware breakpoint rather than injecting a software breakpoint. A maximum of 3 of these can be used per tile.
- watch
Usage:
watch [-location] <expression>Set a watchpoint at a location described by the given expression. A watchpoint (also known as a data breakpoint) will halt the target when the target location is written to. On xCORE, up to 4 hardware watchpoints are supported at a time (any more and they can be emulated with single stepping, which is extremely slow).
For example, to watch for changes in the
my_countervariable:(gdb) watch my_counter
Using the
-locationflag will mean that the expression will be treated as an address, rather than an object. The following 2 examples are equivalent:(gdb) watch *((char *) 0x80250) (gdb) watch --location 0x80250
To watch more than a single word, it is possible to watch an address which is cast to an array of the correct size:
(gdb) watch (int[50]) *0x80250
Advanced commands
These commands should not be required for normal use, but may be useful for certain situations.
- set cosmetic-command
- get cosmetic-command
Usage:
set cosmetic-command <on/off>orget cosmetic-commandCosmetic commands are the commands which are standard GDB commands, that XMOS has overridden with new behaviour. This ‘override’ behaviour can be enabled or disabled. In most cases, the overrides are to make the commands feel more natural in a multi-tile XMOS system. For example, the override behaviour for
loadmeans that all tiles in the system are configured and loaded, not just the currently selected one.The
set/get cosmetic-commandcommands either sets or gets the current state of cosmetic commands, which override certain built-in GDB commands with commands that are more appropriate for use with XMOS multi-tile systems and XE files.Cosmetic commands are enabled by default in XGDB (the overrides are active).
If they are disabled by the user, it is still possible to access the xmos-override versions of the commands by using the always-available name:
Table 10 Cosmetic command overrides¶ Cosmetic override
Always-available name
Description of XMOS changes
filexefileAllows opening of XE files, creating a new inferior for each tile in the system.
loadxeloadLoads every tile in the system, and uses the ‘setup elfs’ from the XE file in order to initialise the system.
runxerunRun every tile in the system, not just the currently selected one.
startxestartStart every tile in the system, not just the currently selected one.
startixestartiStart every tile in the system, not just the currently selected one.
detachxedetachDetach every tile in the system, not just the currently selected one.
attach(none)
Behave the same as the
connectcommand, without resetting the target.Note that the cosmetic commands only override default behaviour when working with XE files. If working directly with ELF files instead of XE files, then XGDB will act according to traditional GDB behaviour and these overrides will not apply. This is out-of-scope of this manual.
- set xcore-catchpoints
- get xcore-catchpoints
Usage:
set xcore-catchpoints <on/off>orget xcore-catchpointsEither set or get the current state of the xCORE exception catchpoints. When enabled, a breakpoint is installed on the target, which will halt the program and print the error whenever there is an unhandled xCORE exception.
A ‘catchpoint’ is a type of breakpoint that occurs on a certain kind of program event, rather than on a specific address, symbol or function.
These are enabled by default in XGDB.
It may be useful to disable this in order to prevent the whole system from being halted once an unhandled exception is hit (which would disrupt real-time behaviour).
- set schedule-multiple
- get schedule-multiple
Usage:
set schedule-multiple <on/off>orget schedule-multipleThis command affects whether or not all inferiors (tiles) are run when using the
continue,stepornext`commands. Ifschedule-multipleis:on, then all inferiors will be continued when any of the continue commands are used.off, then only the currently selected inferior will be resumed when any of the continue commands are used.
For XGDB, the default is
on.This command can be useful, for example, if you want to freeze all other tiles while just debugging the currently selected tile. For instance if the secondary tile would create a lot of stdout messages, or drive signals to connected hardware.
See also:
set scheduler-locking.
- set scheduler-locking
- get scheduler-locking
Usage:
set scheduler-locking <on/off/step>orget scheduler-lockingThis command affects whether or not all threads (logical cores) are run when using the
continue,stepornextcommands. Ifscheduler-lockingis:off, then all threads will run when any continue command is used.on, then only the current thread will run when any continue command is used.step, then when stepping only the current thread will run, but for any other continue command all of the threads will be run.
For XGDB, the default is
off.Note that changing this may result in threads becoming unable to progress when inter-thread synchronising instructions are called.
This command can be useful, for example, if you want to freeze all other threads while just debugging the currently selected thread. For instance if debugging and stepping through an algorithmic part of the code that does not interface with other tiles, it can be convenient to just not run them.
See also:
set schedule-multiple.
Environment
- NO_COLOR
If the NO_COLOR environment variable is set to a non-empty value, then all colour output of XGDB will be suppressed, reverting to plain monochrome font. Note that the suppression of colour output is automatic if XGDB detects that it is not outputting to a TTY (such as when it is being piped to a file).
To change the shade of the colours that GDB is using, check the settings of your terminal, as GDB is using ANSI escape sequences to ask the terminal to display from a palette of colours, which can usually be reconfigured by the user.