Performance Characterisation for SSRC ASRC DS3 and OS3#
The FFT plots in this section provide a visual guide to the performance of the SSRC, ASRC, DS3 and OS3 sample rate converters. Test signals were created allowing analysis of the sample rate converter output across different scenarios.
Two input signals were played through a stereo sample rate converter across a range of input and output sample rates. For Channel 0, a single pure tone was generated ensuring its frequency was well within the overall nyquist rate. For Channel 1, multiple tones spaced logarithmically were generated with the spacing most dense at higher frequencies.
The resulting frequency plot output clearly shows the noise floor relative to the sample rate converted injected tone(s). The plots are annotated with an estimate of the Signal to Noise Ratio (SNR) as well as Total Harmonic Distortion (THD).
For the case of the ASRC, in addition to the nominal input frequency of 0 PPM deviation, the +/-100 PPM frequency deviation cases are also shown.
Pure Tone FFT SRC Plots Across Sample Rate Combinations#
Frequency error: 0.999900Hz#
Output Fs : 16,000Hz#
No SRC available for this scenario.
Output Fs : 32,000Hz#
No SRC available for this scenario.
Output Fs : 44,100Hz#
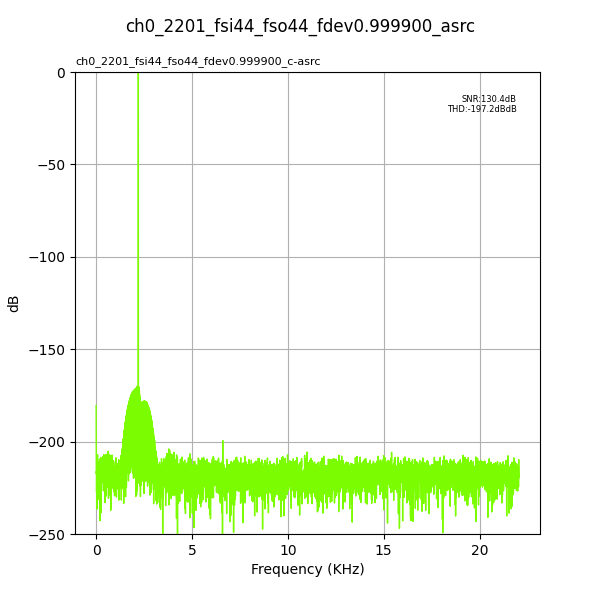
Fig. 11 Input Fs: 44,100Hz, Output Fs: 44,100Hz, Fs error: 0.999900, Results for: asrc#
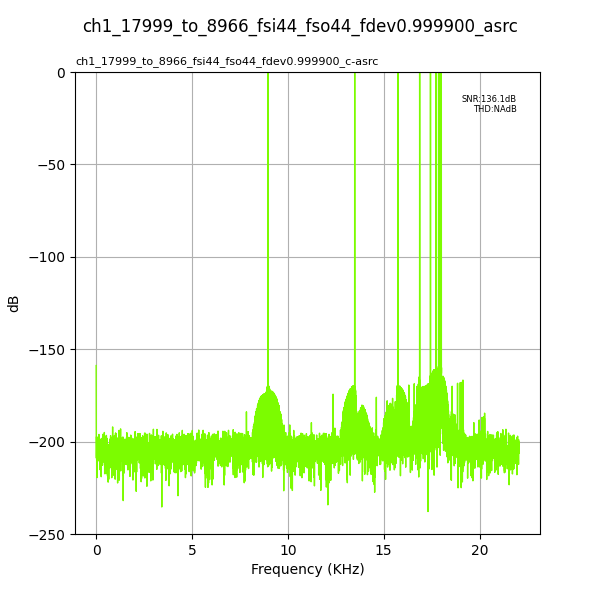
Fig. 12 Input Fs: 44,100Hz, Output Fs: 44,100Hz, Fs error: 0.999900, Results for: asrc#
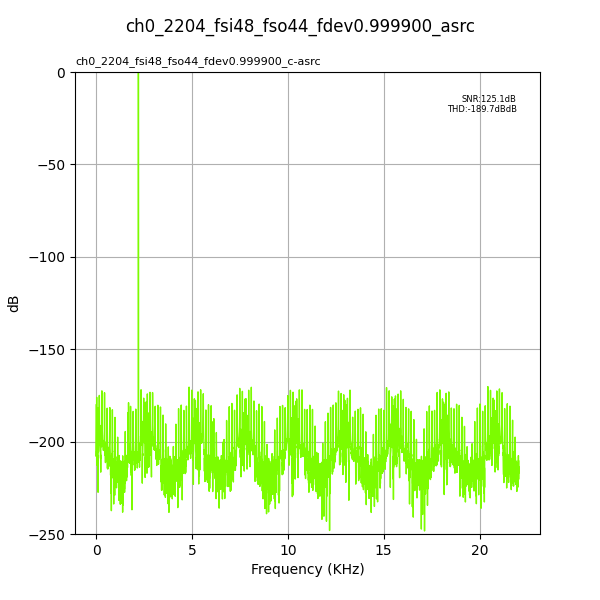
Fig. 13 Input Fs: 48,000Hz, Output Fs: 44,100Hz, Fs error: 0.999900, Results for: asrc#
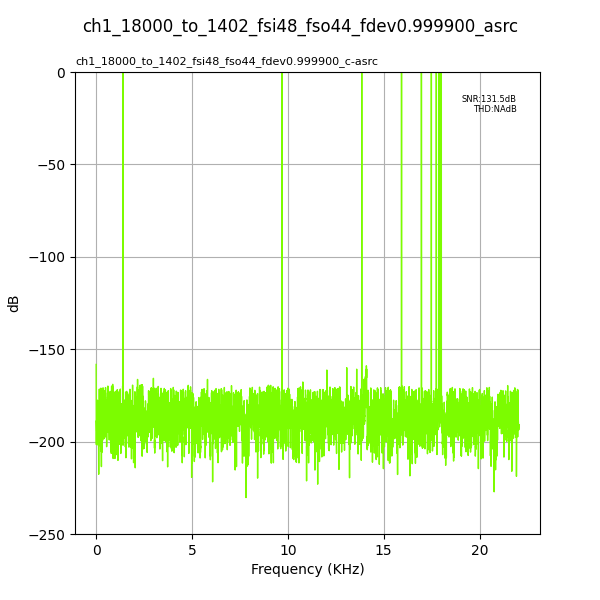
Fig. 14 Input Fs: 48,000Hz, Output Fs: 44,100Hz, Fs error: 0.999900, Results for: asrc#
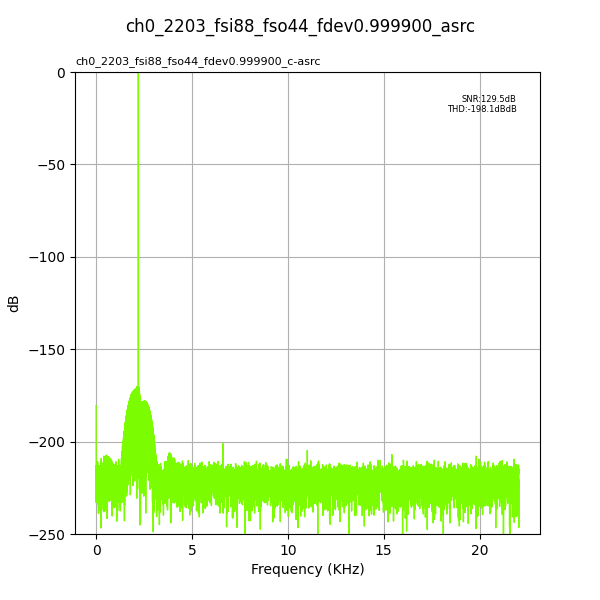
Fig. 15 Input Fs: 88,200Hz, Output Fs: 44,100Hz, Fs error: 0.999900, Results for: asrc#
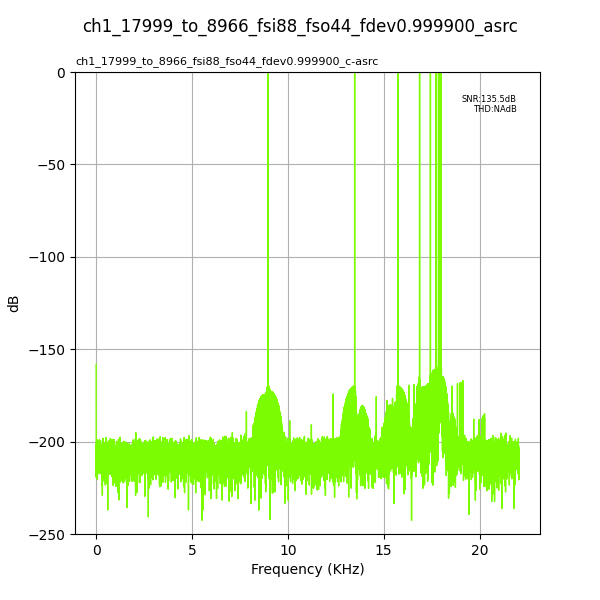
Fig. 16 Input Fs: 88,200Hz, Output Fs: 44,100Hz, Fs error: 0.999900, Results for: asrc#
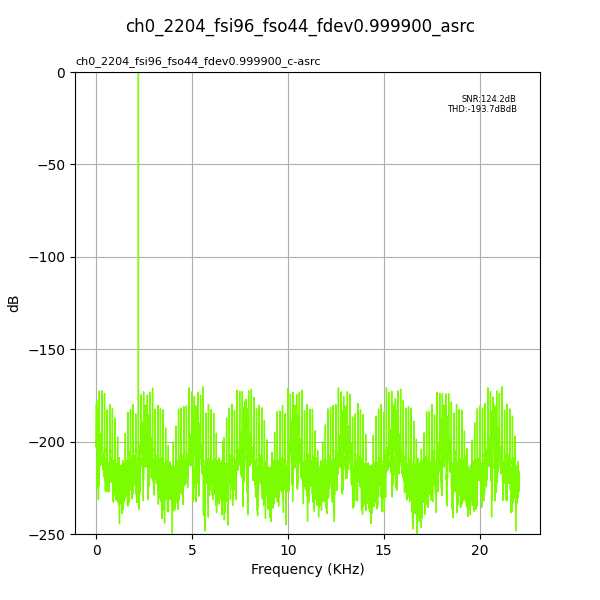
Fig. 17 Input Fs: 96,000Hz, Output Fs: 44,100Hz, Fs error: 0.999900, Results for: asrc#
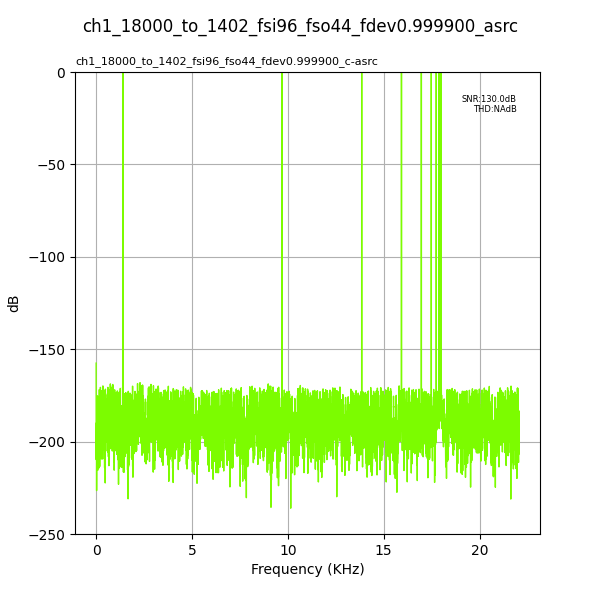
Fig. 18 Input Fs: 96,000Hz, Output Fs: 44,100Hz, Fs error: 0.999900, Results for: asrc#
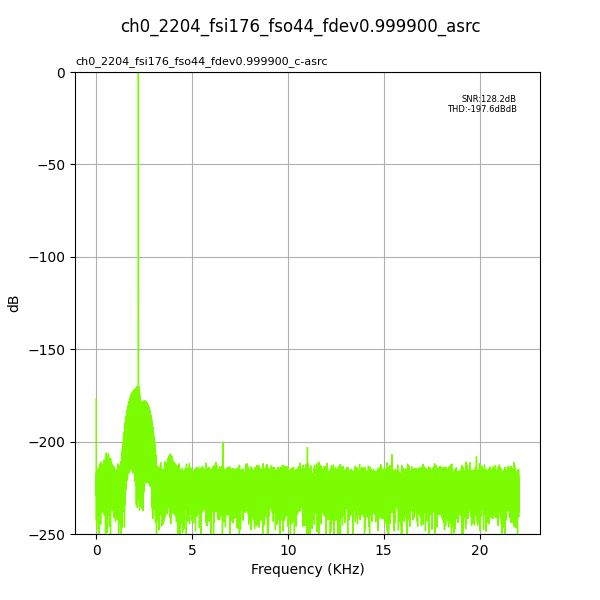
Fig. 19 Input Fs: 176,400Hz, Output Fs: 44,100Hz, Fs error: 0.999900, Results for: asrc#
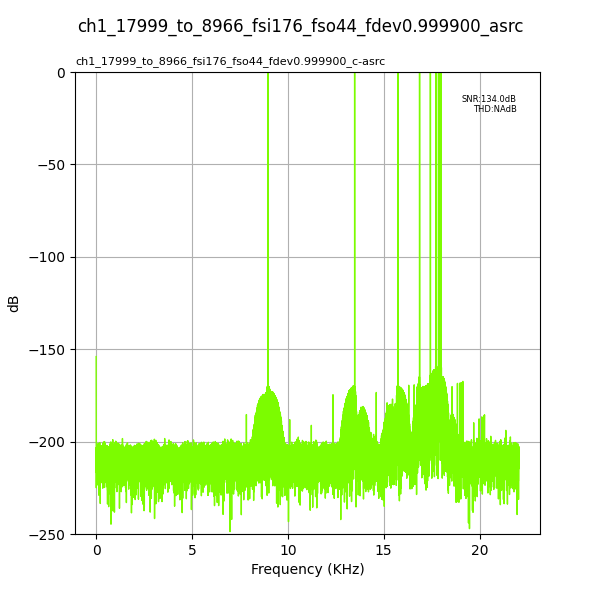
Fig. 20 Input Fs: 176,400Hz, Output Fs: 44,100Hz, Fs error: 0.999900, Results for: asrc#
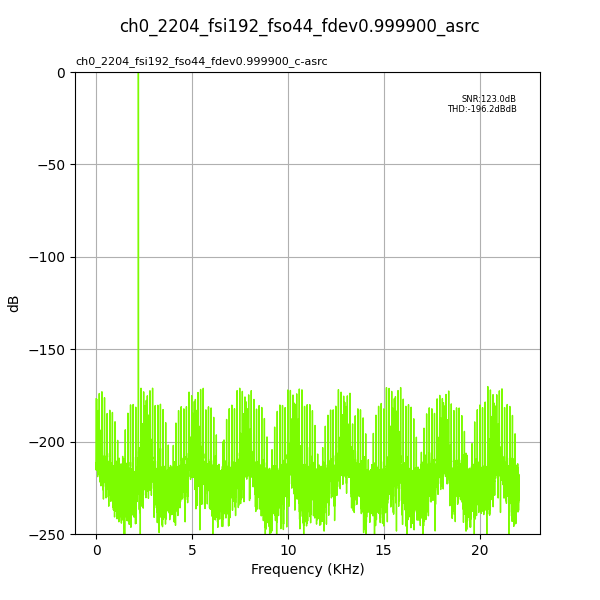
Fig. 21 Input Fs: 192,000Hz, Output Fs: 44,100Hz, Fs error: 0.999900, Results for: asrc#
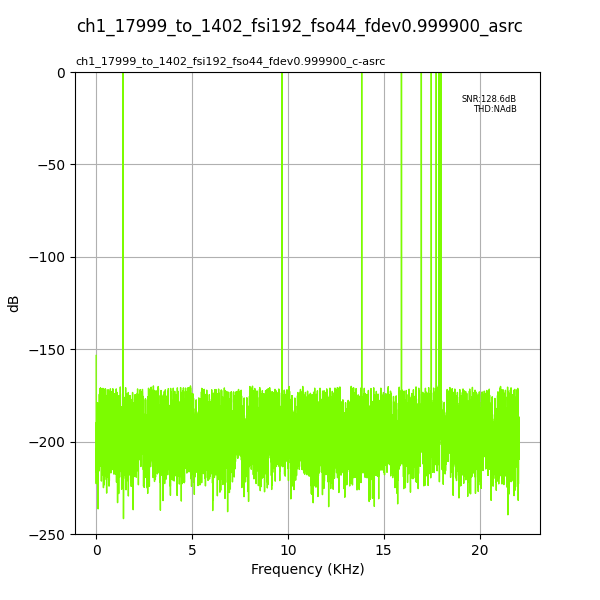
Fig. 22 Input Fs: 192,000Hz, Output Fs: 44,100Hz, Fs error: 0.999900, Results for: asrc#
Output Fs : 48,000Hz#
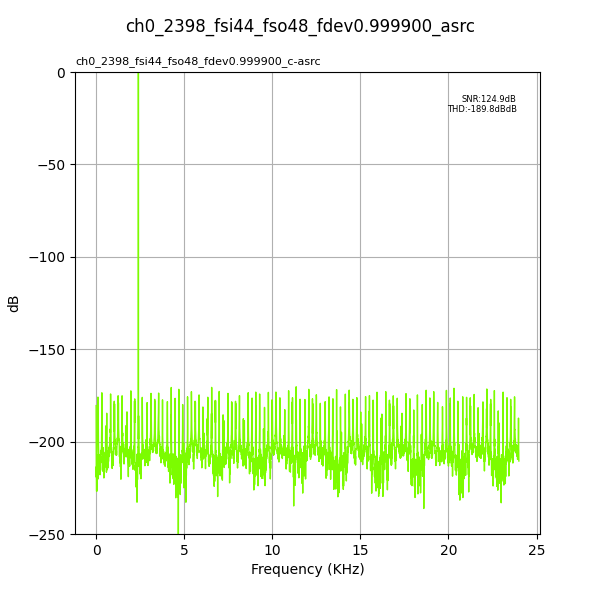
Fig. 23 Input Fs: 44,100Hz, Output Fs: 48,000Hz, Fs error: 0.999900, Results for: asrc#
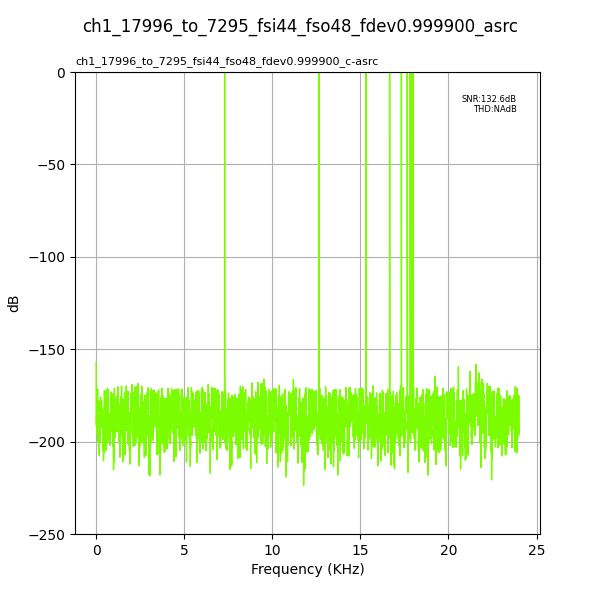
Fig. 24 Input Fs: 44,100Hz, Output Fs: 48,000Hz, Fs error: 0.999900, Results for: asrc#
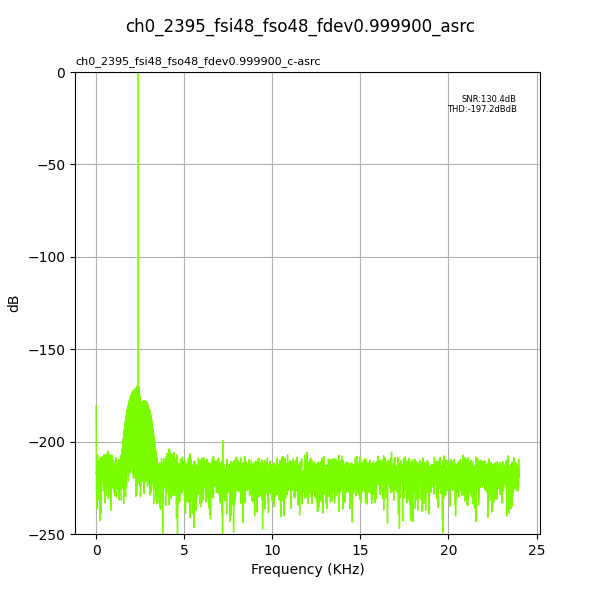
Fig. 25 Input Fs: 48,000Hz, Output Fs: 48,000Hz, Fs error: 0.999900, Results for: asrc#
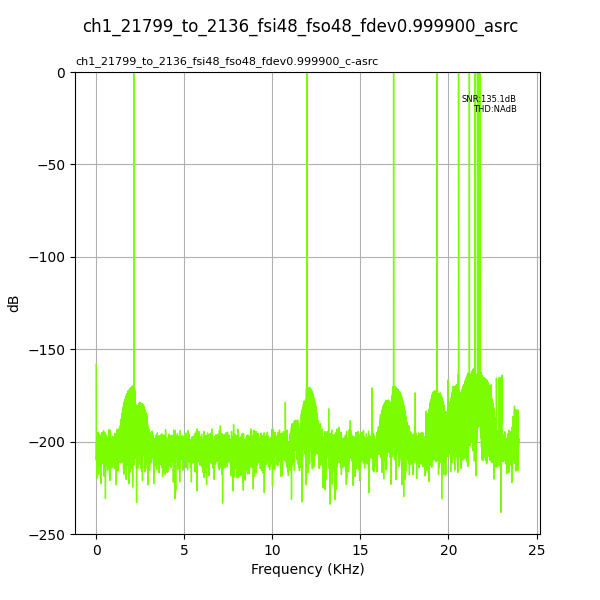
Fig. 26 Input Fs: 48,000Hz, Output Fs: 48,000Hz, Fs error: 0.999900, Results for: asrc#
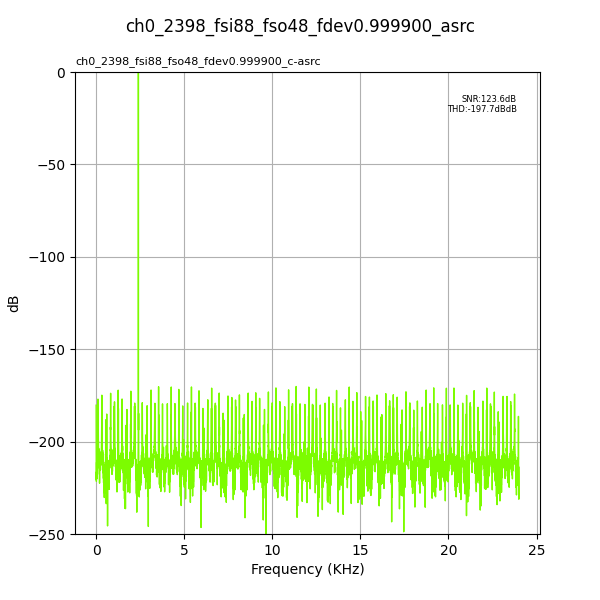
Fig. 27 Input Fs: 88,200Hz, Output Fs: 48,000Hz, Fs error: 0.999900, Results for: asrc#
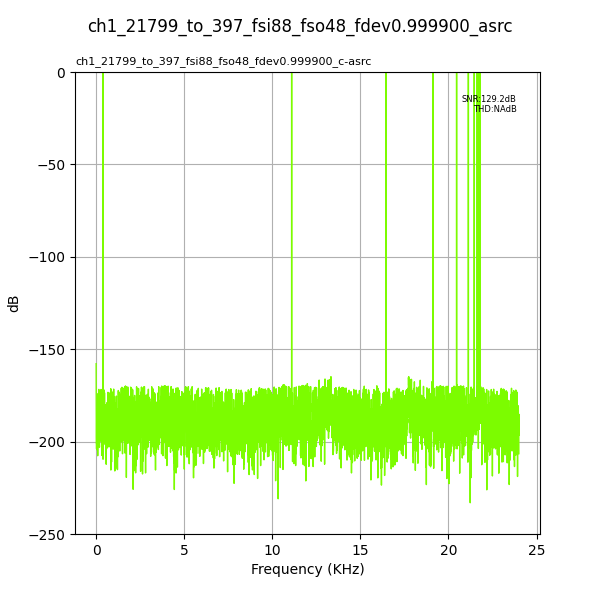
Fig. 28 Input Fs: 88,200Hz, Output Fs: 48,000Hz, Fs error: 0.999900, Results for: asrc#
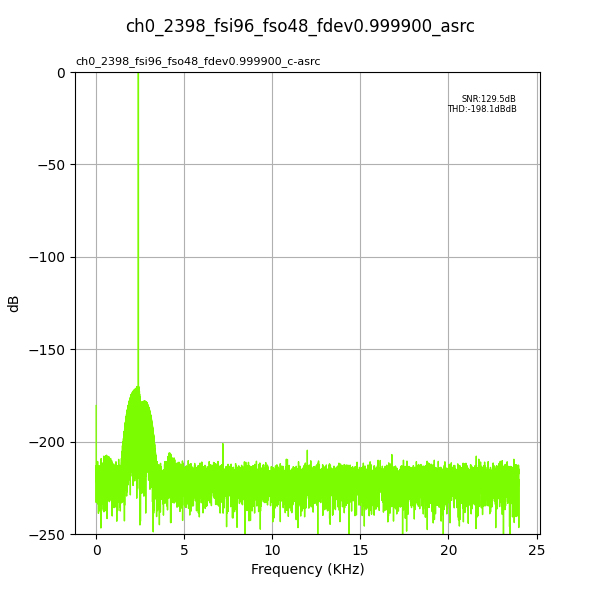
Fig. 29 Input Fs: 96,000Hz, Output Fs: 48,000Hz, Fs error: 0.999900, Results for: asrc#
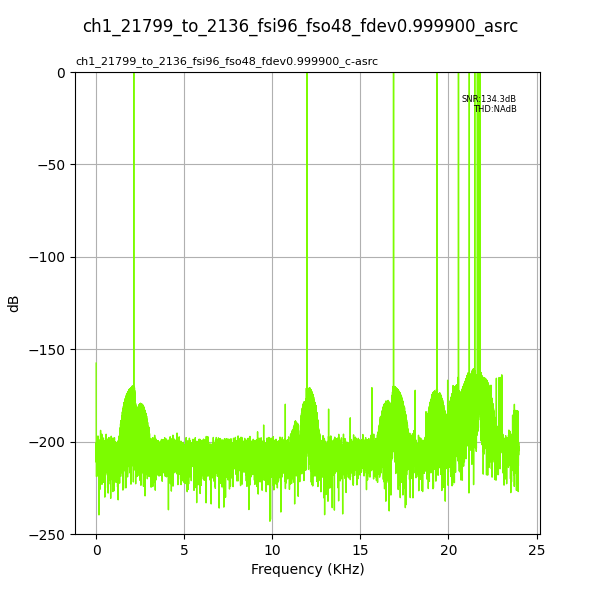
Fig. 30 Input Fs: 96,000Hz, Output Fs: 48,000Hz, Fs error: 0.999900, Results for: asrc#
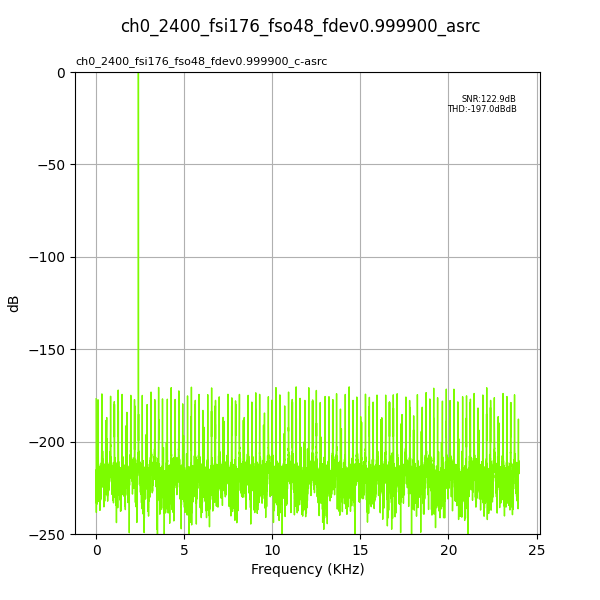
Fig. 31 Input Fs: 176,400Hz, Output Fs: 48,000Hz, Fs error: 0.999900, Results for: asrc#
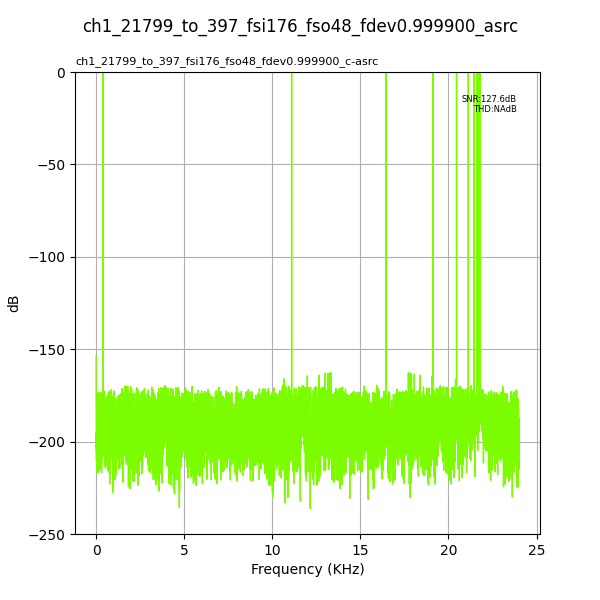
Fig. 32 Input Fs: 176,400Hz, Output Fs: 48,000Hz, Fs error: 0.999900, Results for: asrc#
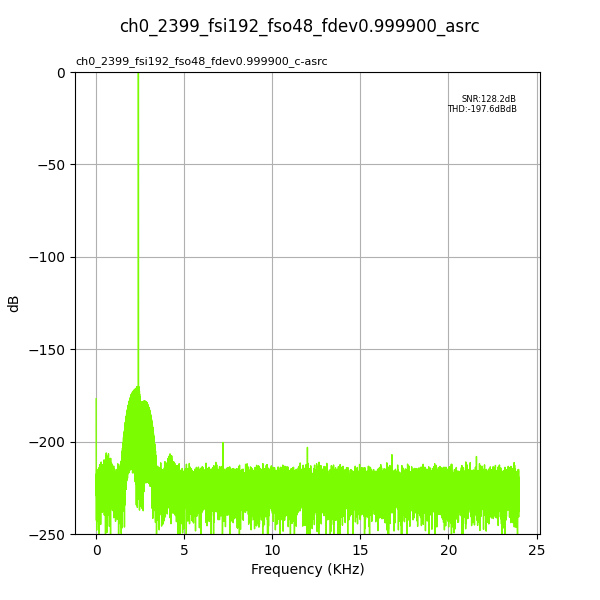
Fig. 33 Input Fs: 192,000Hz, Output Fs: 48,000Hz, Fs error: 0.999900, Results for: asrc#
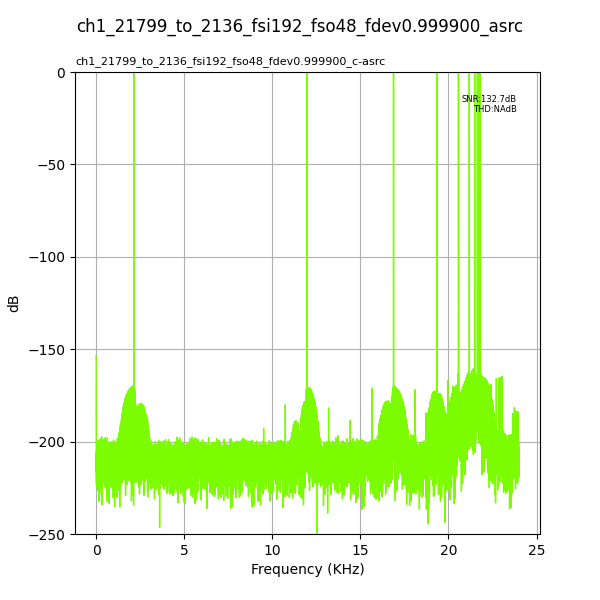
Fig. 34 Input Fs: 192,000Hz, Output Fs: 48,000Hz, Fs error: 0.999900, Results for: asrc#
Output Fs : 88,200Hz#
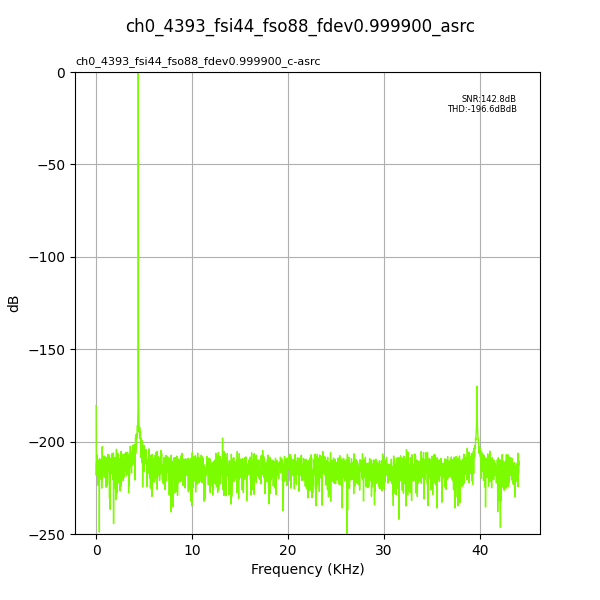
Fig. 35 Input Fs: 44,100Hz, Output Fs: 88,200Hz, Fs error: 0.999900, Results for: asrc#
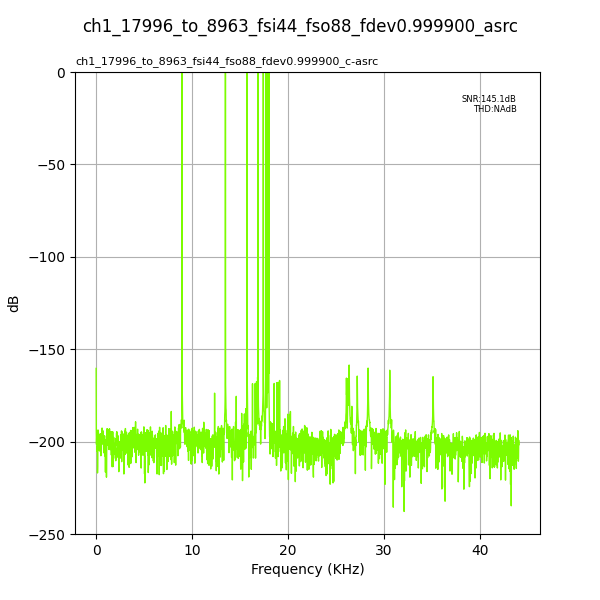
Fig. 36 Input Fs: 44,100Hz, Output Fs: 88,200Hz, Fs error: 0.999900, Results for: asrc#
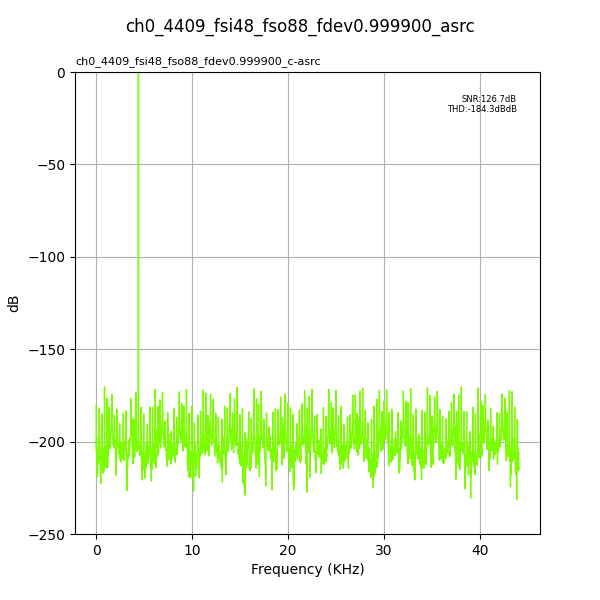
Fig. 37 Input Fs: 48,000Hz, Output Fs: 88,200Hz, Fs error: 0.999900, Results for: asrc#
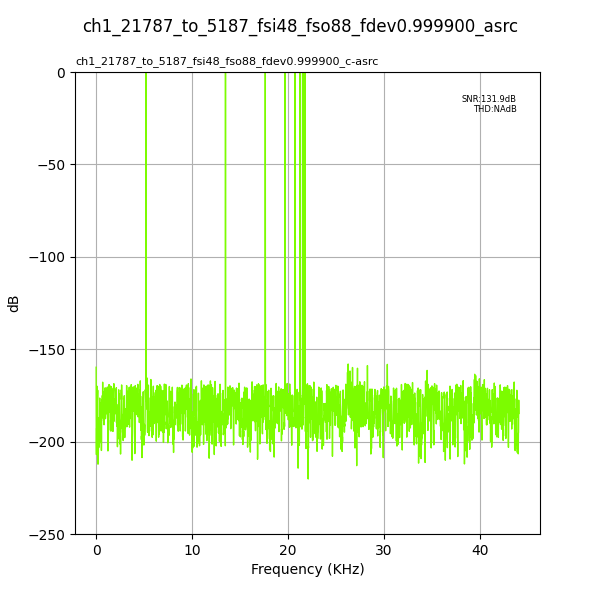
Fig. 38 Input Fs: 48,000Hz, Output Fs: 88,200Hz, Fs error: 0.999900, Results for: asrc#
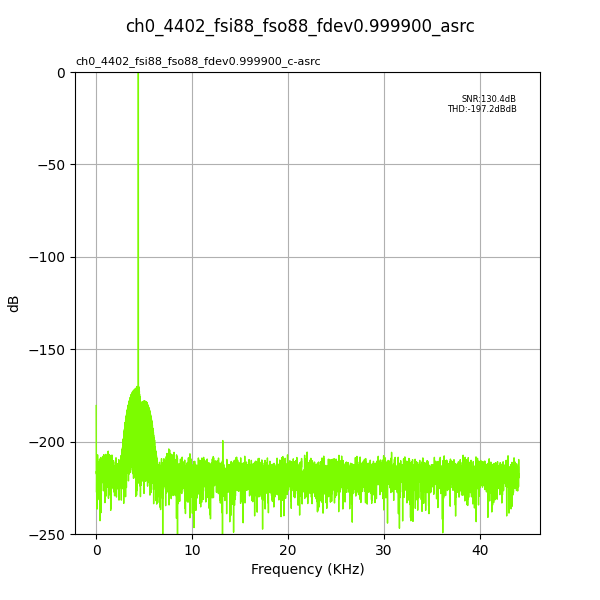
Fig. 39 Input Fs: 88,200Hz, Output Fs: 88,200Hz, Fs error: 0.999900, Results for: asrc#
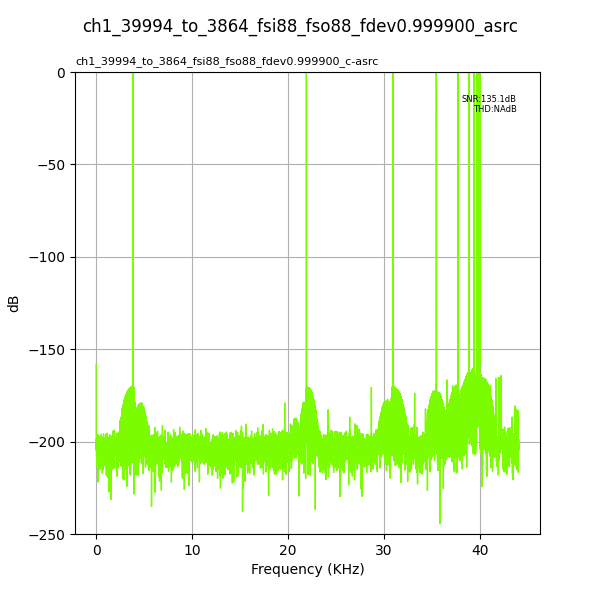
Fig. 40 Input Fs: 88,200Hz, Output Fs: 88,200Hz, Fs error: 0.999900, Results for: asrc#
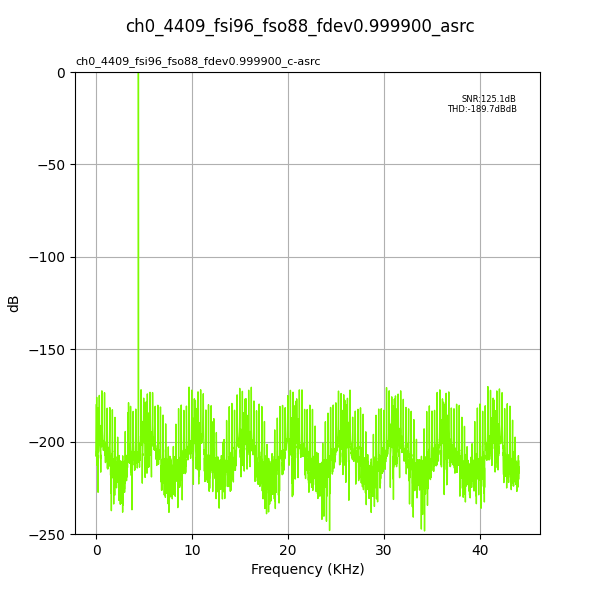
Fig. 41 Input Fs: 96,000Hz, Output Fs: 88,200Hz, Fs error: 0.999900, Results for: asrc#
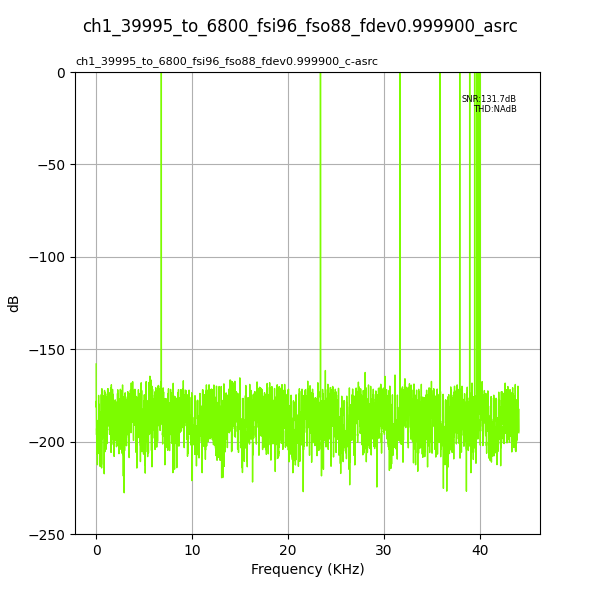
Fig. 42 Input Fs: 96,000Hz, Output Fs: 88,200Hz, Fs error: 0.999900, Results for: asrc#
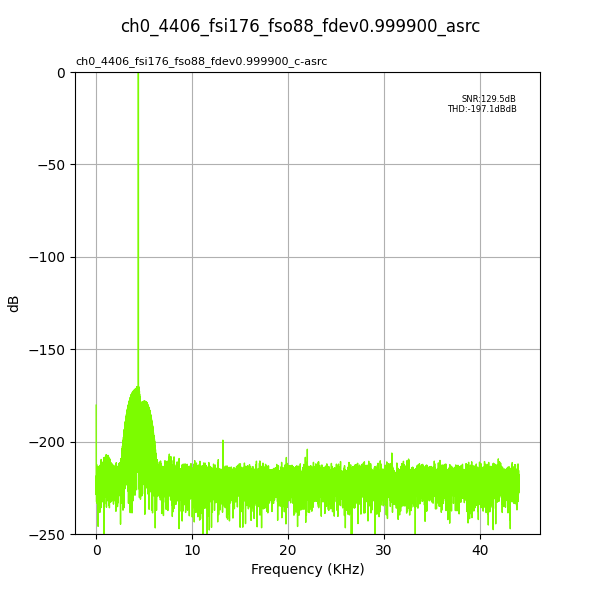
Fig. 43 Input Fs: 176,400Hz, Output Fs: 88,200Hz, Fs error: 0.999900, Results for: asrc#
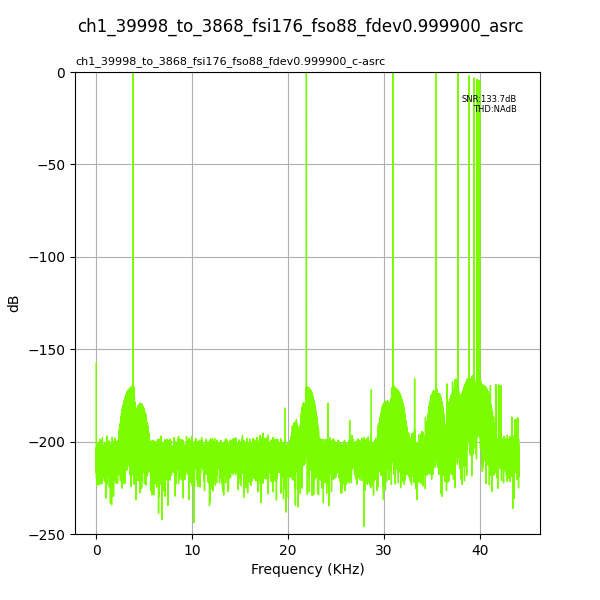
Fig. 44 Input Fs: 176,400Hz, Output Fs: 88,200Hz, Fs error: 0.999900, Results for: asrc#
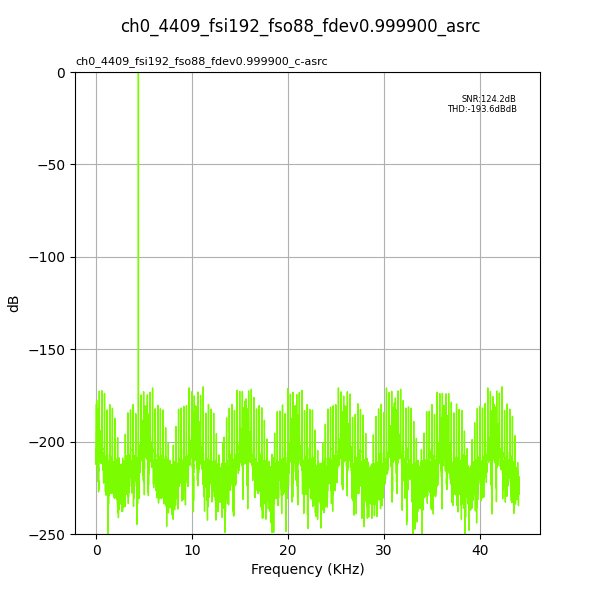
Fig. 45 Input Fs: 192,000Hz, Output Fs: 88,200Hz, Fs error: 0.999900, Results for: asrc#
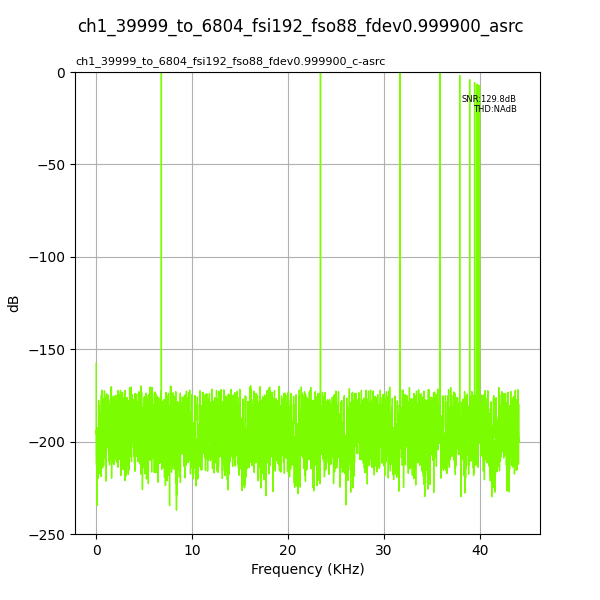
Fig. 46 Input Fs: 192,000Hz, Output Fs: 88,200Hz, Fs error: 0.999900, Results for: asrc#
Output Fs : 96,000Hz#
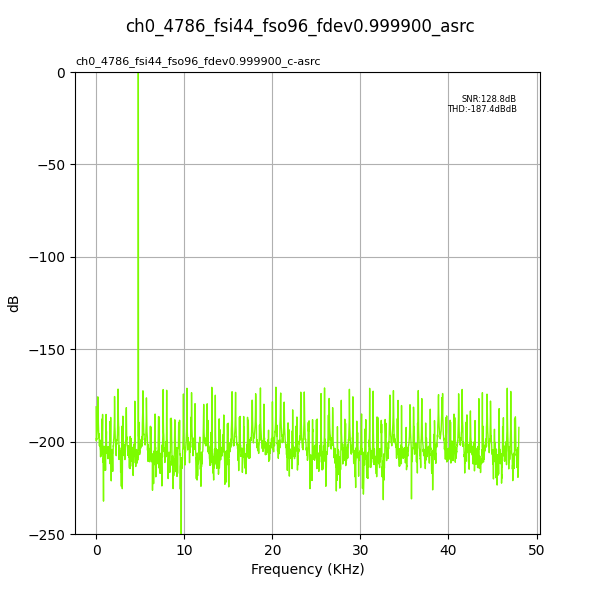
Fig. 47 Input Fs: 44,100Hz, Output Fs: 96,000Hz, Fs error: 0.999900, Results for: asrc#
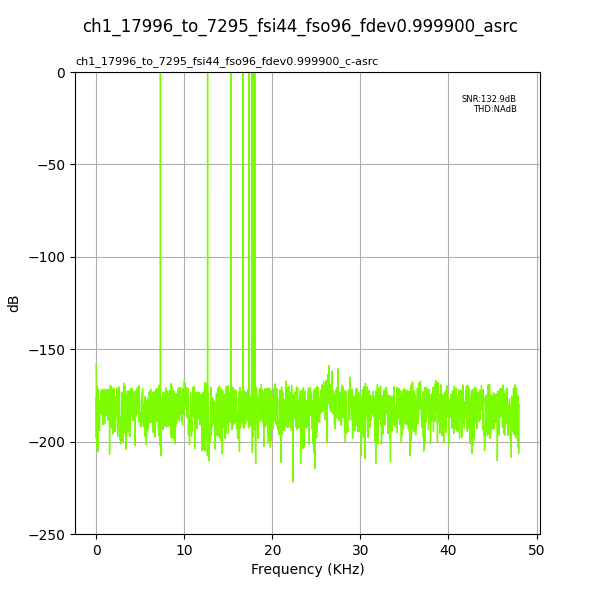
Fig. 48 Input Fs: 44,100Hz, Output Fs: 96,000Hz, Fs error: 0.999900, Results for: asrc#
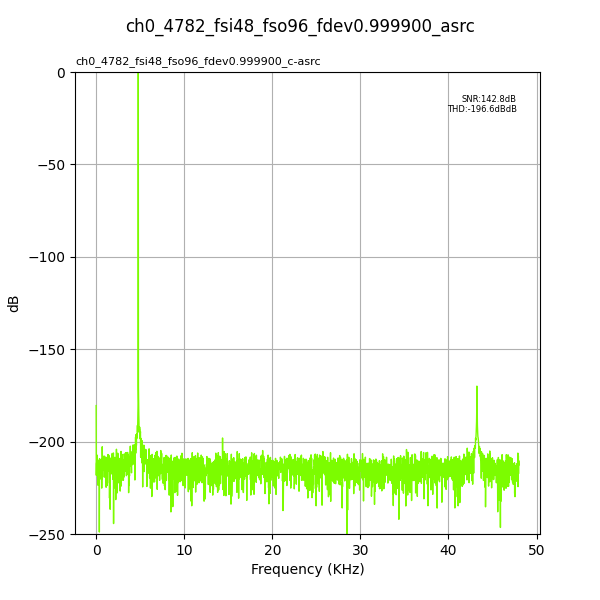
Fig. 49 Input Fs: 48,000Hz, Output Fs: 96,000Hz, Fs error: 0.999900, Results for: asrc#
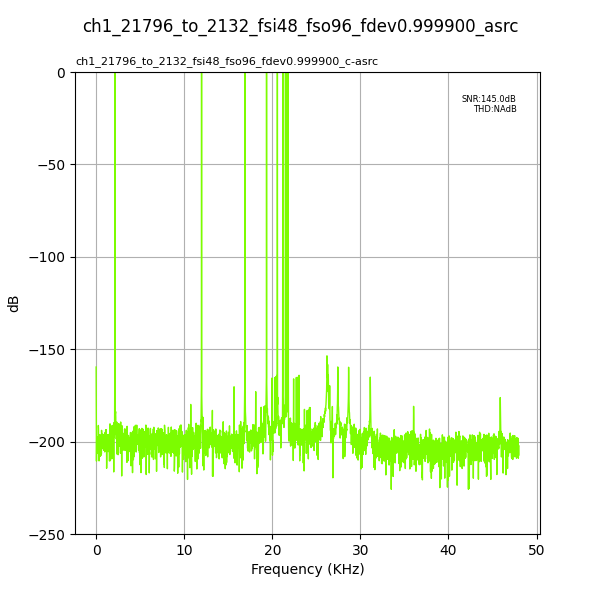
Fig. 50 Input Fs: 48,000Hz, Output Fs: 96,000Hz, Fs error: 0.999900, Results for: asrc#
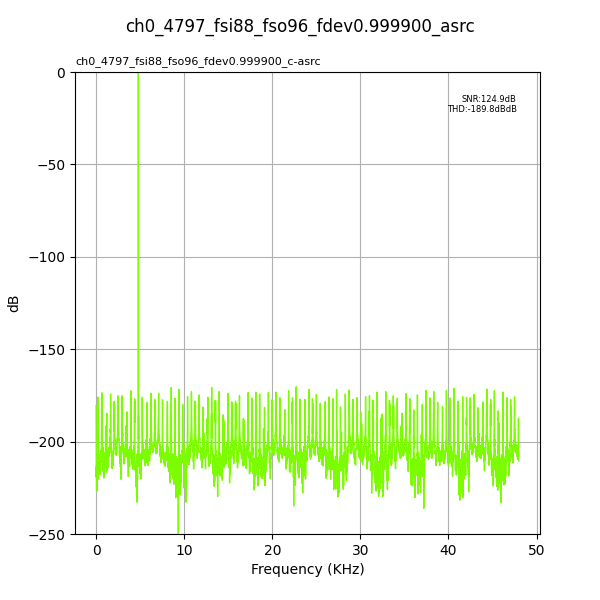
Fig. 51 Input Fs: 88,200Hz, Output Fs: 96,000Hz, Fs error: 0.999900, Results for: asrc#
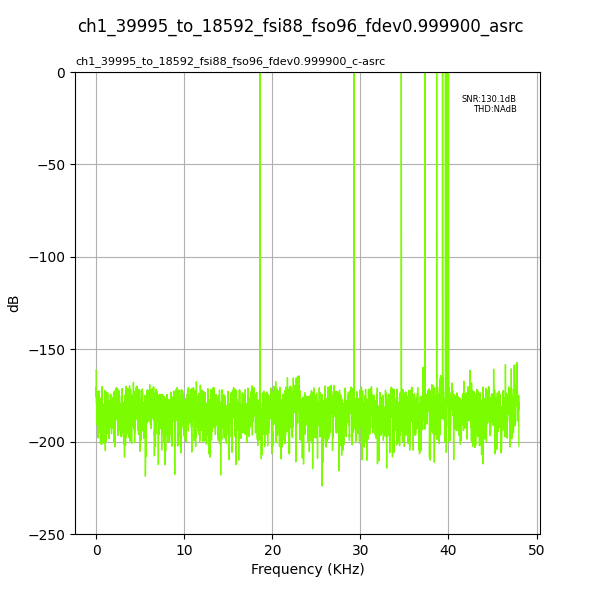
Fig. 52 Input Fs: 88,200Hz, Output Fs: 96,000Hz, Fs error: 0.999900, Results for: asrc#
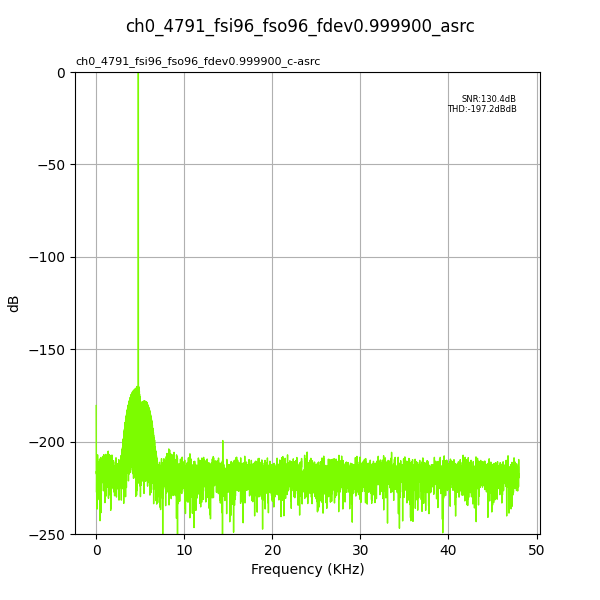
Fig. 53 Input Fs: 96,000Hz, Output Fs: 96,000Hz, Fs error: 0.999900, Results for: asrc#
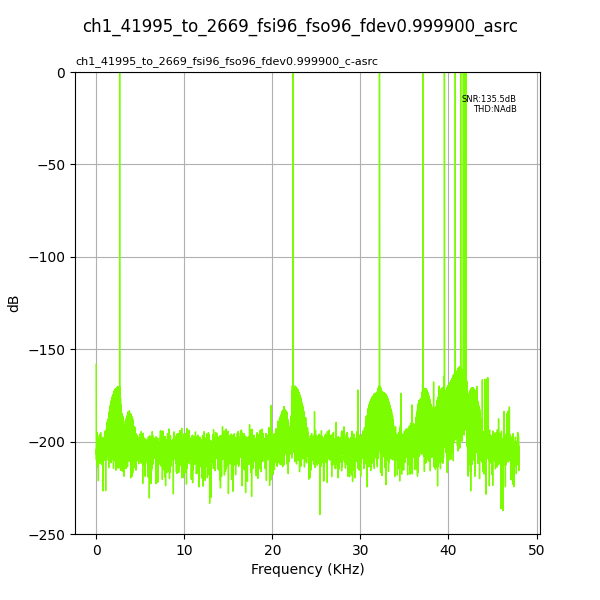
Fig. 54 Input Fs: 96,000Hz, Output Fs: 96,000Hz, Fs error: 0.999900, Results for: asrc#
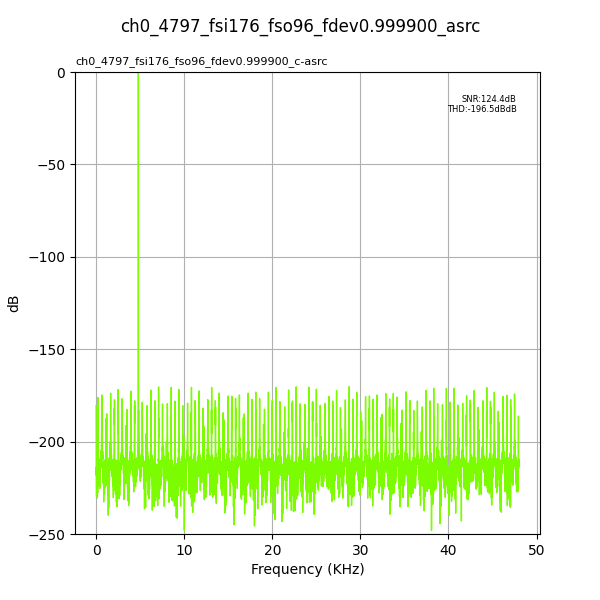
Fig. 55 Input Fs: 176,400Hz, Output Fs: 96,000Hz, Fs error: 0.999900, Results for: asrc#
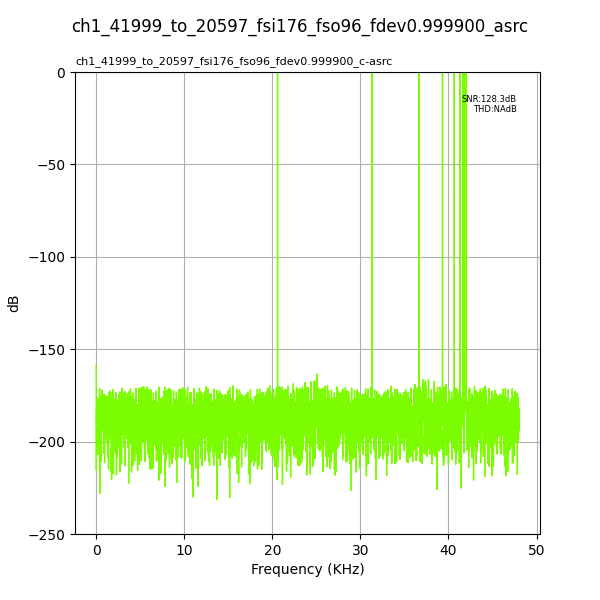
Fig. 56 Input Fs: 176,400Hz, Output Fs: 96,000Hz, Fs error: 0.999900, Results for: asrc#
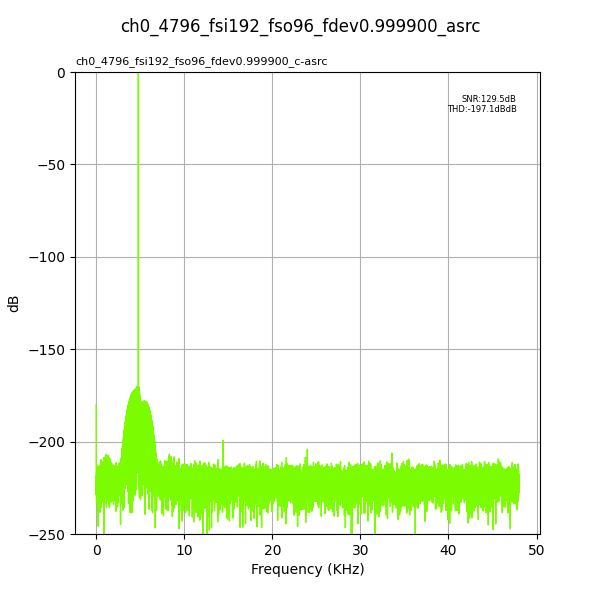
Fig. 57 Input Fs: 192,000Hz, Output Fs: 96,000Hz, Fs error: 0.999900, Results for: asrc#
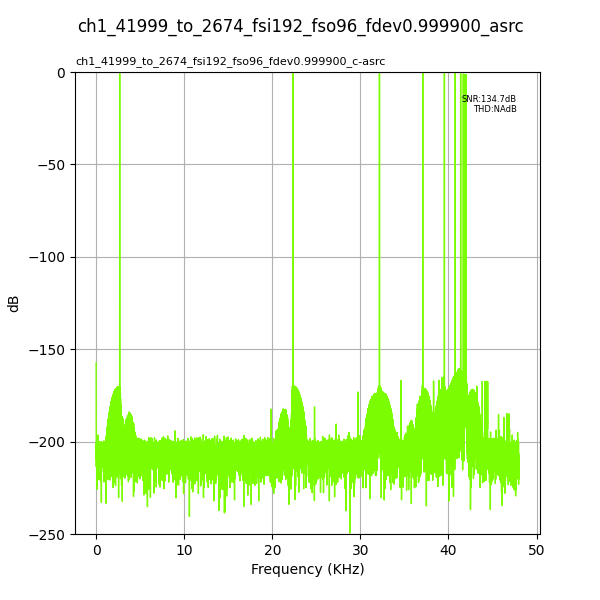
Fig. 58 Input Fs: 192,000Hz, Output Fs: 96,000Hz, Fs error: 0.999900, Results for: asrc#
Output Fs : 176,400Hz#
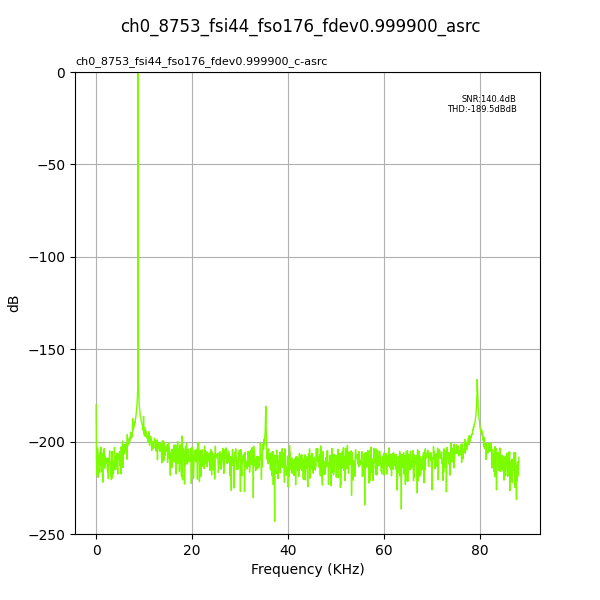
Fig. 59 Input Fs: 44,100Hz, Output Fs: 176,400Hz, Fs error: 0.999900, Results for: asrc#
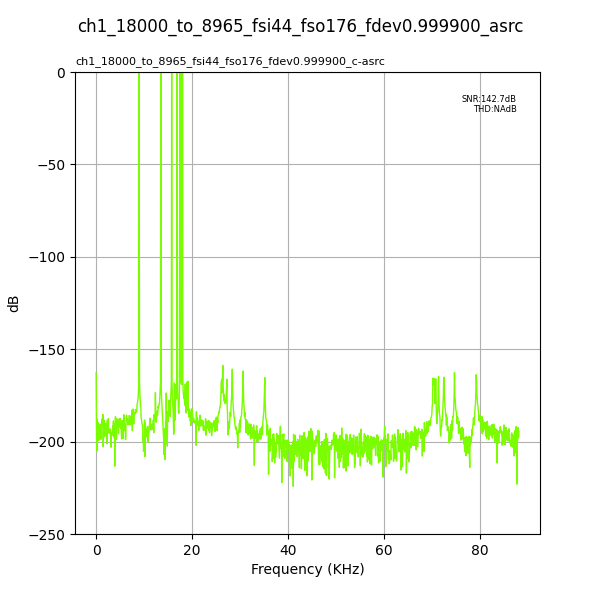
Fig. 60 Input Fs: 44,100Hz, Output Fs: 176,400Hz, Fs error: 0.999900, Results for: asrc#
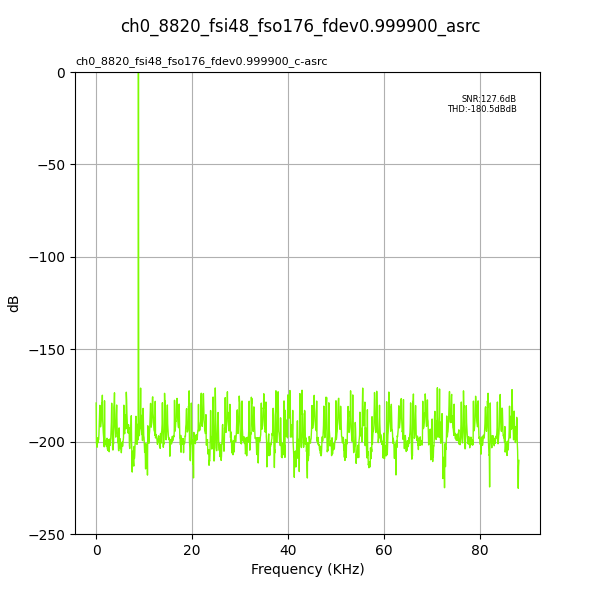
Fig. 61 Input Fs: 48,000Hz, Output Fs: 176,400Hz, Fs error: 0.999900, Results for: asrc#
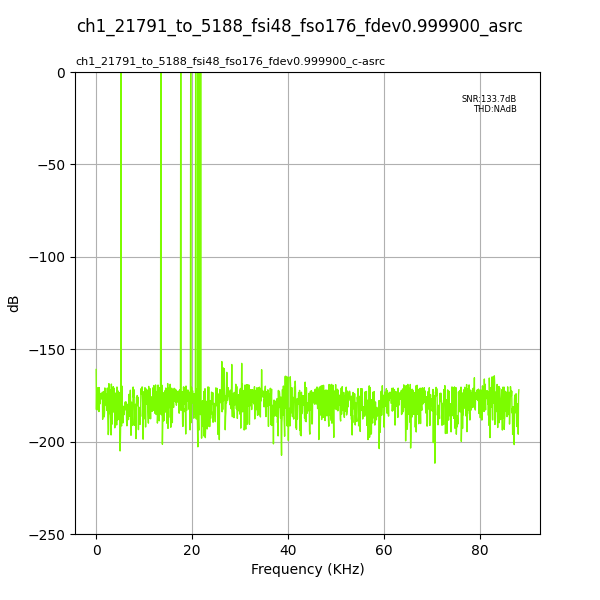
Fig. 62 Input Fs: 48,000Hz, Output Fs: 176,400Hz, Fs error: 0.999900, Results for: asrc#
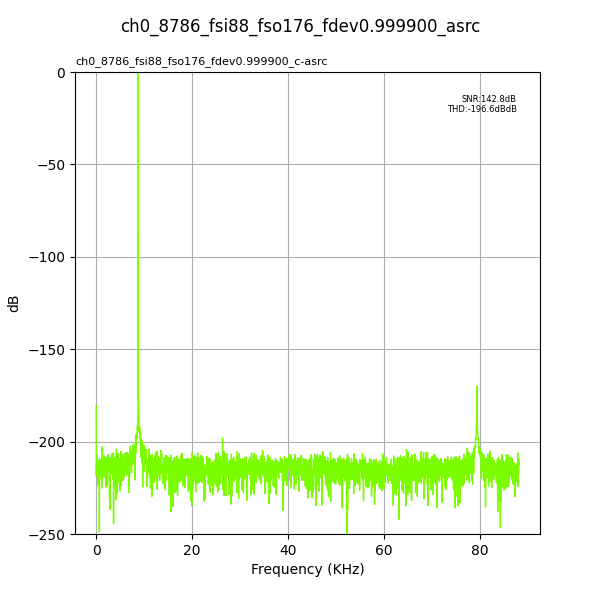
Fig. 63 Input Fs: 88,200Hz, Output Fs: 176,400Hz, Fs error: 0.999900, Results for: asrc#
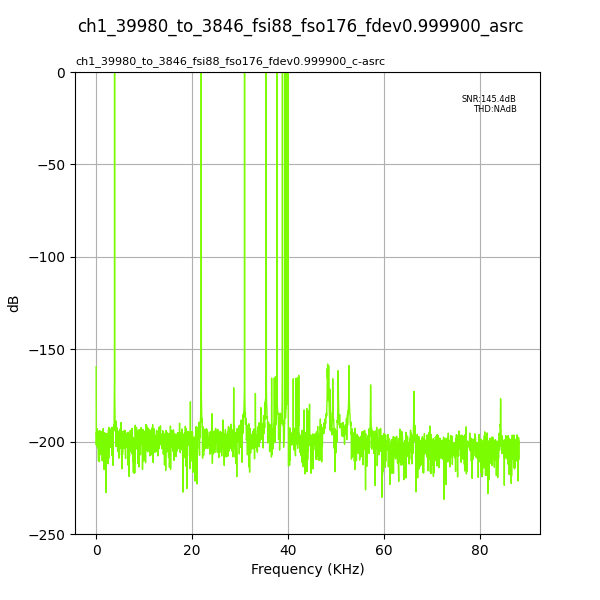
Fig. 64 Input Fs: 88,200Hz, Output Fs: 176,400Hz, Fs error: 0.999900, Results for: asrc#
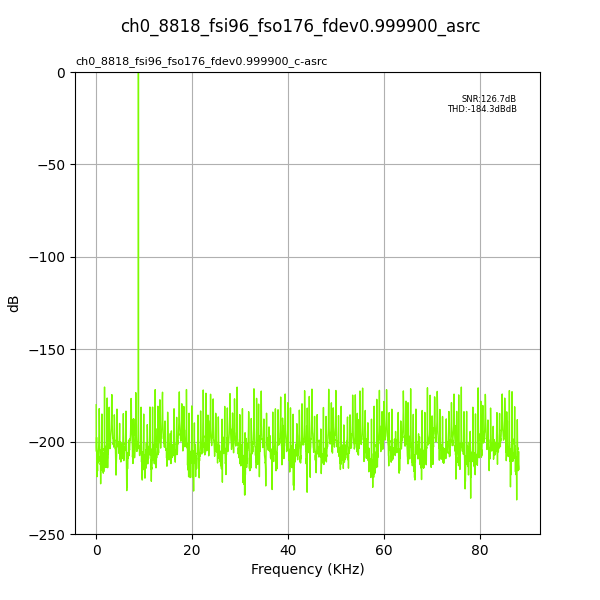
Fig. 65 Input Fs: 96,000Hz, Output Fs: 176,400Hz, Fs error: 0.999900, Results for: asrc#
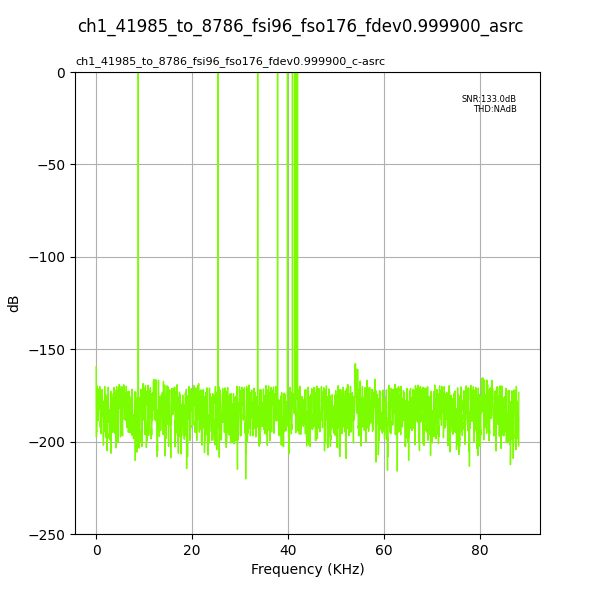
Fig. 66 Input Fs: 96,000Hz, Output Fs: 176,400Hz, Fs error: 0.999900, Results for: asrc#
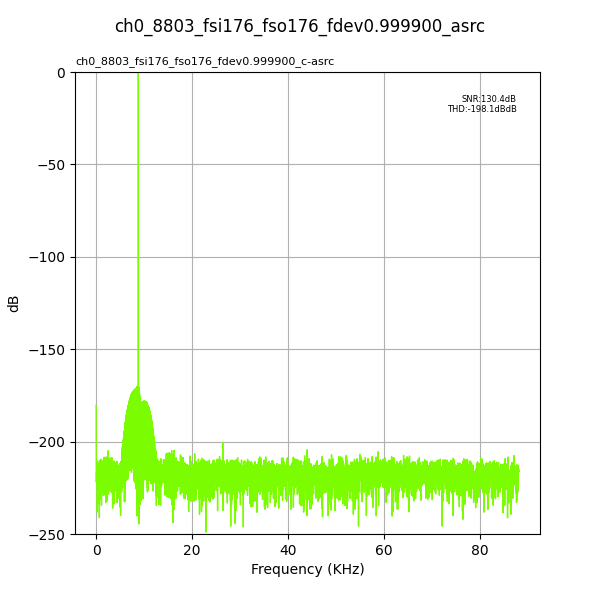
Fig. 67 Input Fs: 176,400Hz, Output Fs: 176,400Hz, Fs error: 0.999900, Results for: asrc#
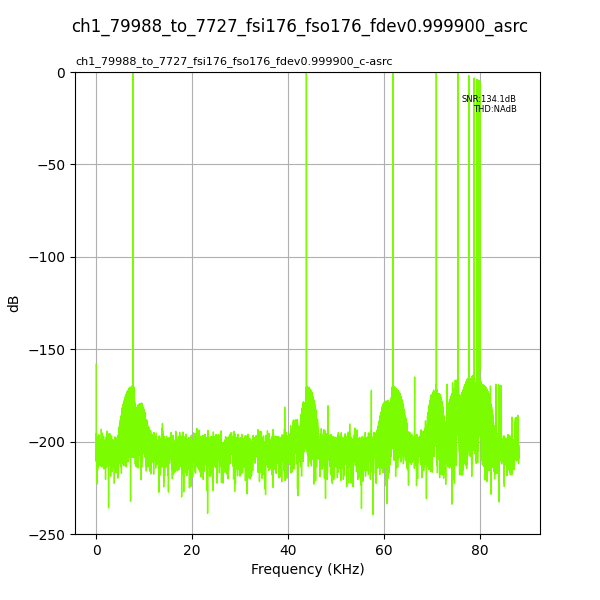
Fig. 68 Input Fs: 176,400Hz, Output Fs: 176,400Hz, Fs error: 0.999900, Results for: asrc#
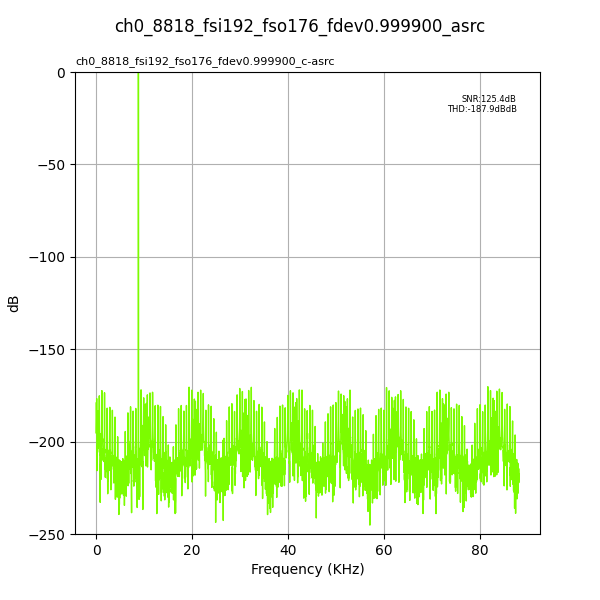
Fig. 69 Input Fs: 192,000Hz, Output Fs: 176,400Hz, Fs error: 0.999900, Results for: asrc#
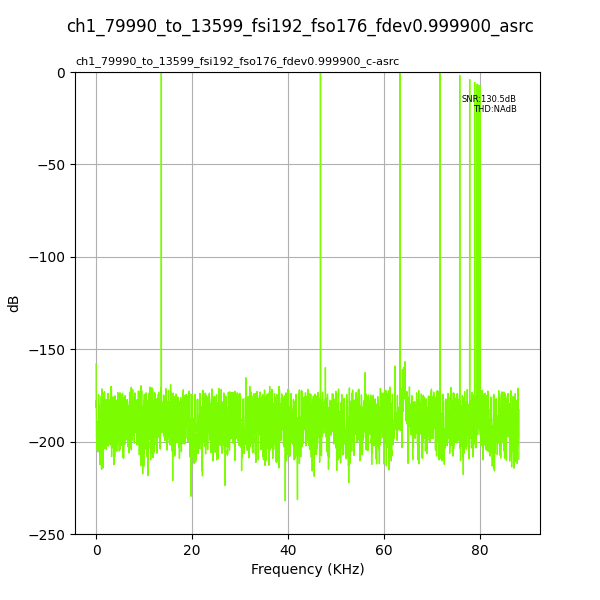
Fig. 70 Input Fs: 192,000Hz, Output Fs: 176,400Hz, Fs error: 0.999900, Results for: asrc#
Output Fs : 192,000Hz#
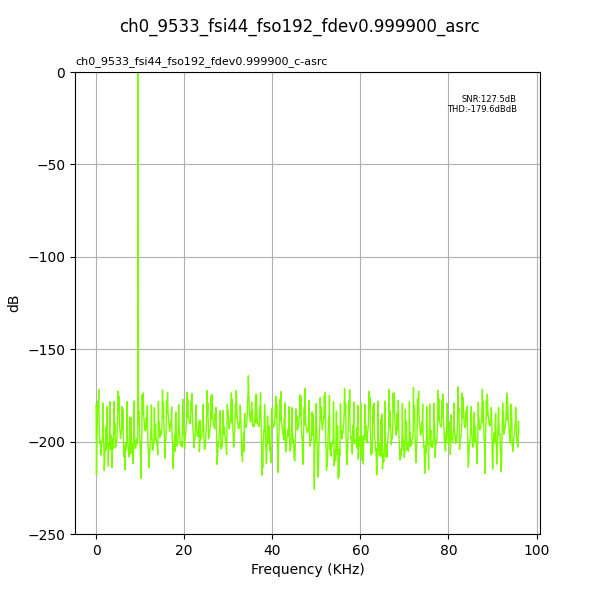
Fig. 71 Input Fs: 44,100Hz, Output Fs: 192,000Hz, Fs error: 0.999900, Results for: asrc#
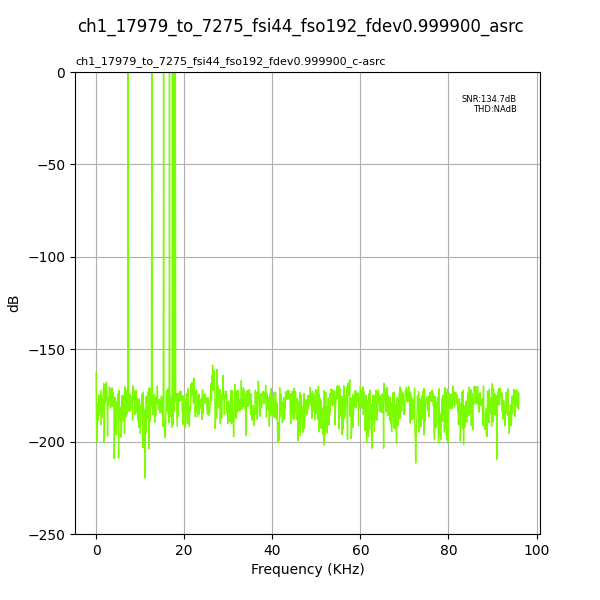
Fig. 72 Input Fs: 44,100Hz, Output Fs: 192,000Hz, Fs error: 0.999900, Results for: asrc#
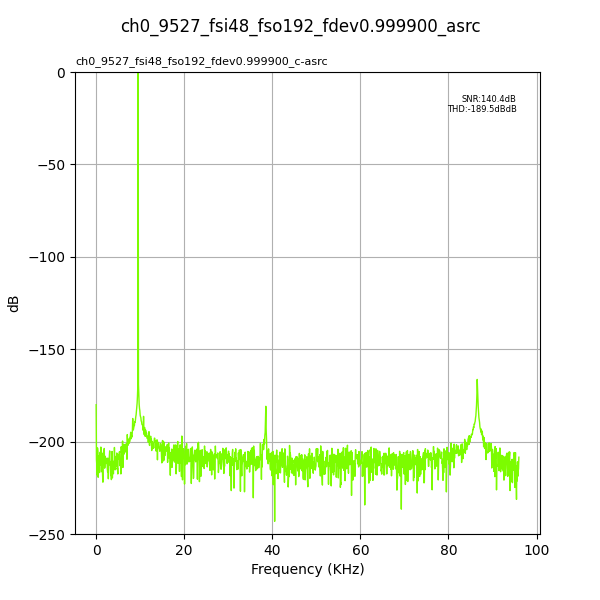
Fig. 73 Input Fs: 48,000Hz, Output Fs: 192,000Hz, Fs error: 0.999900, Results for: asrc#
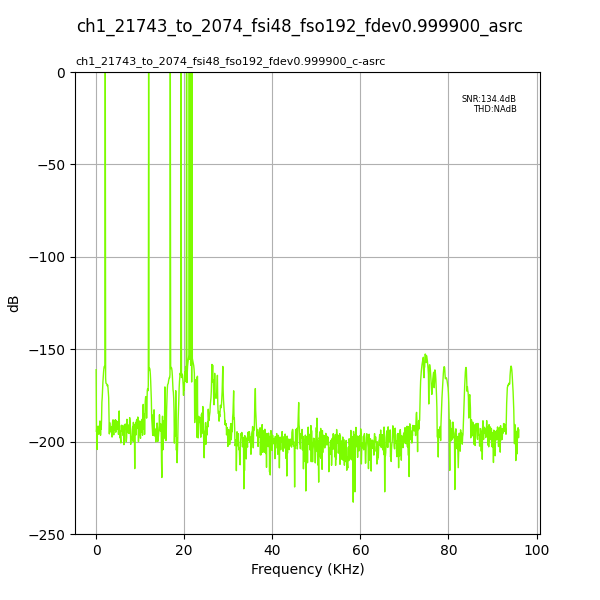
Fig. 74 Input Fs: 48,000Hz, Output Fs: 192,000Hz, Fs error: 0.999900, Results for: asrc#
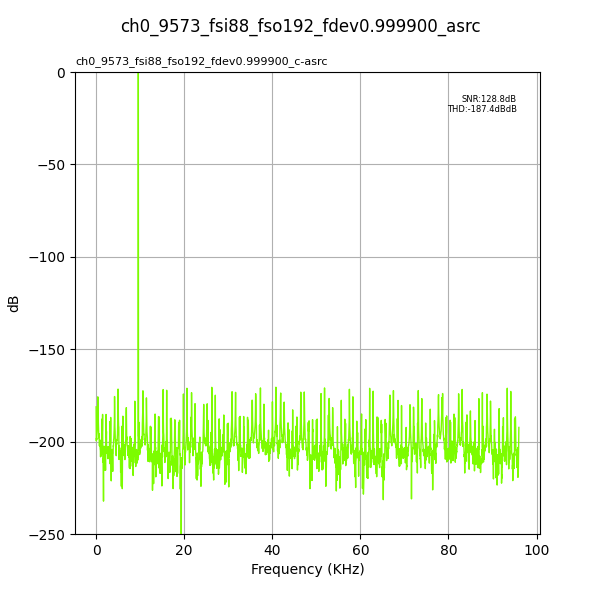
Fig. 75 Input Fs: 88,200Hz, Output Fs: 192,000Hz, Fs error: 0.999900, Results for: asrc#
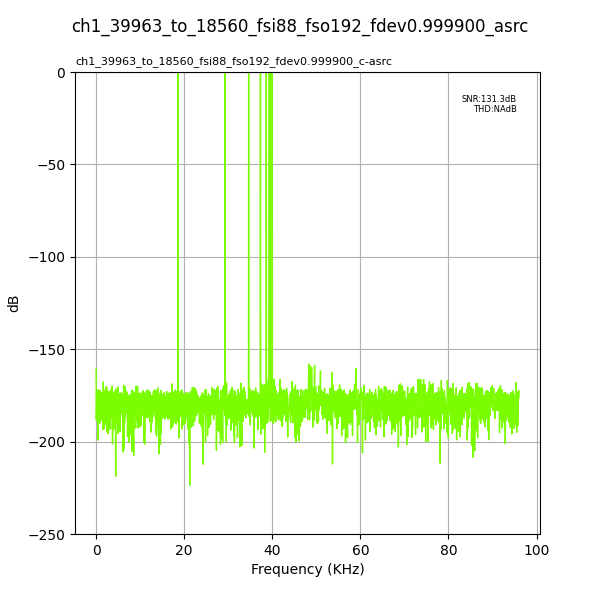
Fig. 76 Input Fs: 88,200Hz, Output Fs: 192,000Hz, Fs error: 0.999900, Results for: asrc#
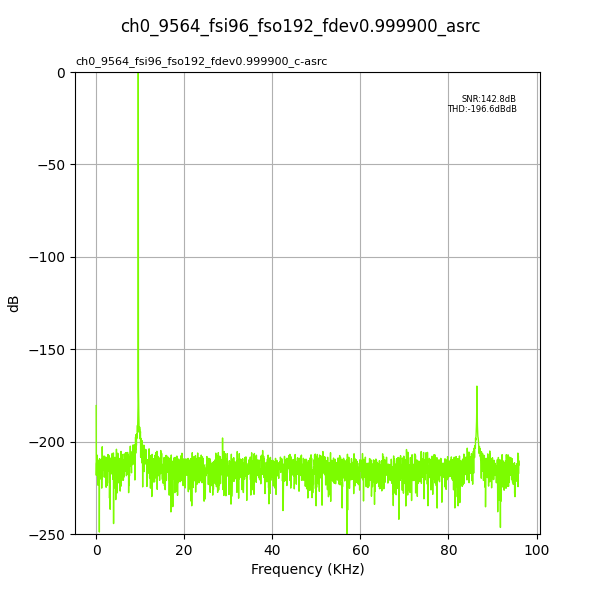
Fig. 77 Input Fs: 96,000Hz, Output Fs: 192,000Hz, Fs error: 0.999900, Results for: asrc#
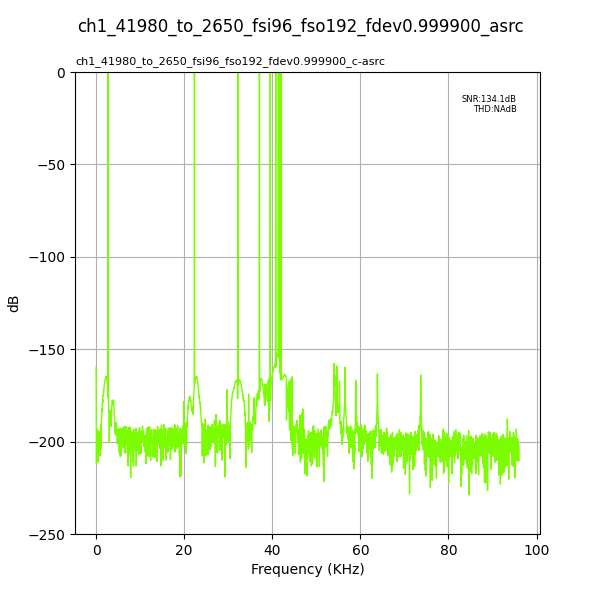
Fig. 78 Input Fs: 96,000Hz, Output Fs: 192,000Hz, Fs error: 0.999900, Results for: asrc#
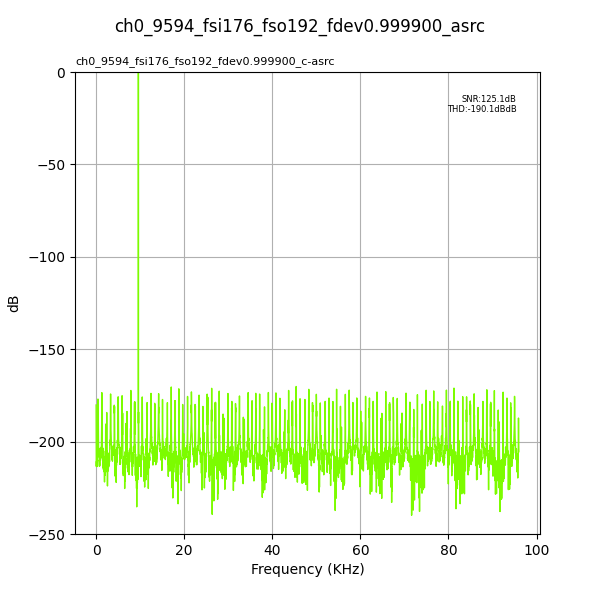
Fig. 79 Input Fs: 176,400Hz, Output Fs: 192,000Hz, Fs error: 0.999900, Results for: asrc#
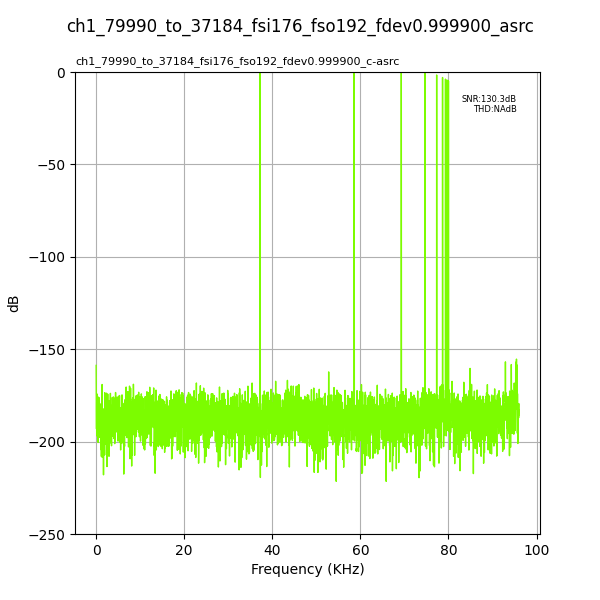
Fig. 80 Input Fs: 176,400Hz, Output Fs: 192,000Hz, Fs error: 0.999900, Results for: asrc#
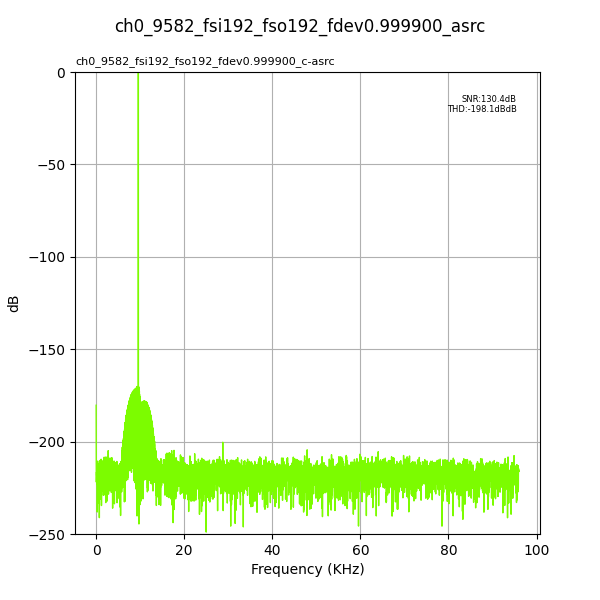
Fig. 81 Input Fs: 192,000Hz, Output Fs: 192,000Hz, Fs error: 0.999900, Results for: asrc#
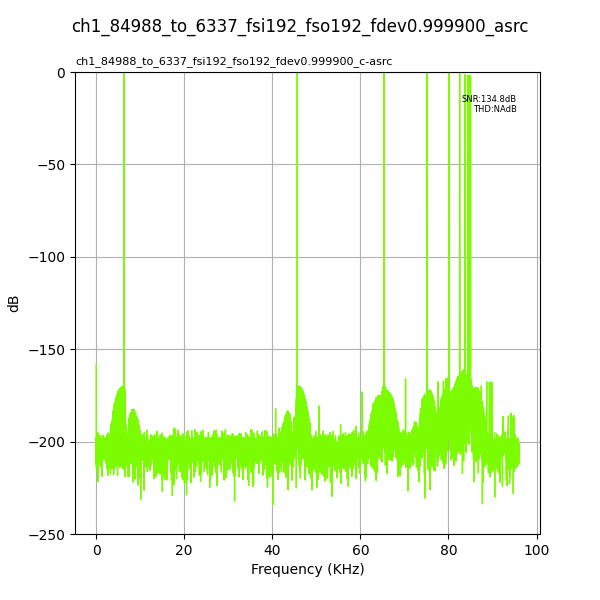
Fig. 82 Input Fs: 192,000Hz, Output Fs: 192,000Hz, Fs error: 0.999900, Results for: asrc#
Frequency error: 1.000000Hz#
Output Fs : 16,000Hz#
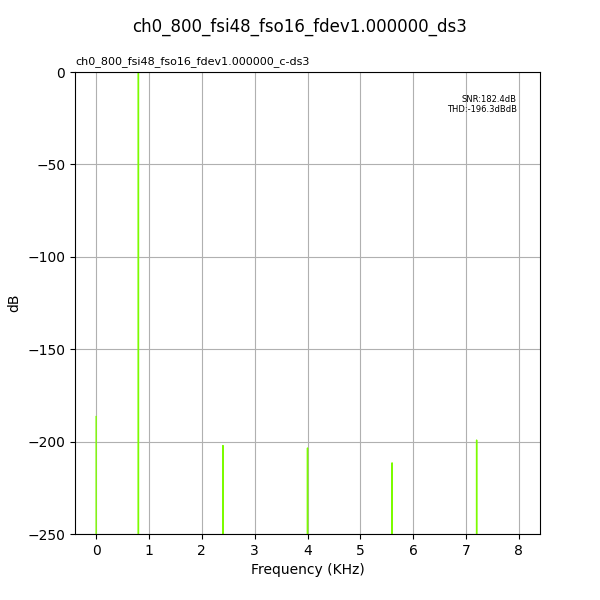
Fig. 83 Input Fs: 48,000Hz, Output Fs: 16,000Hz, Fs error: 1.000000, Results for: ds3#
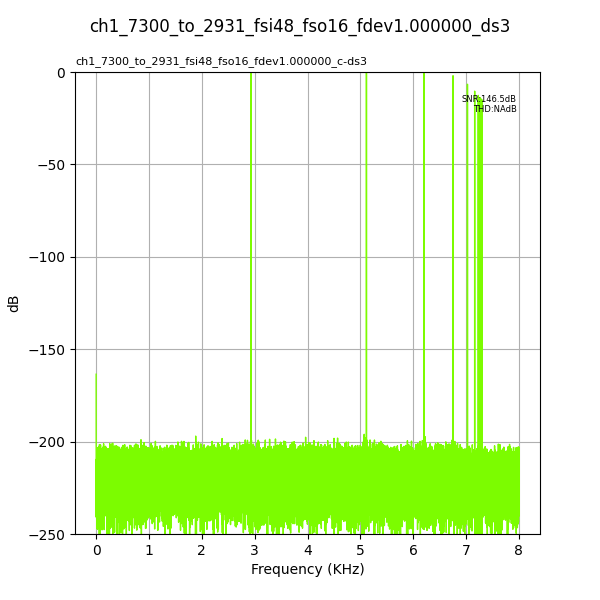
Fig. 84 Input Fs: 48,000Hz, Output Fs: 16,000Hz, Fs error: 1.000000, Results for: ds3#
Output Fs : 32,000Hz#
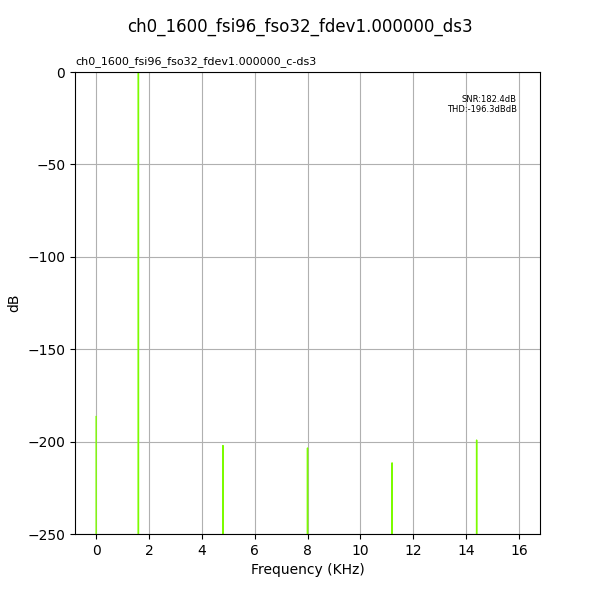
Fig. 85 Input Fs: 96,000Hz, Output Fs: 32,000Hz, Fs error: 1.000000, Results for: ds3#
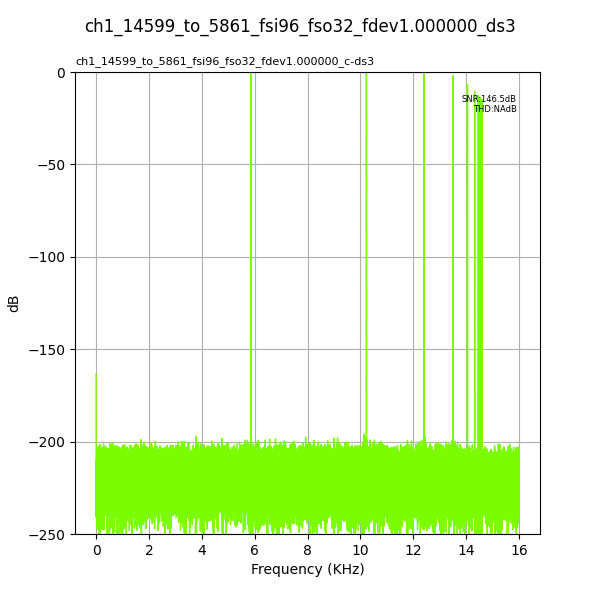
Fig. 86 Input Fs: 96,000Hz, Output Fs: 32,000Hz, Fs error: 1.000000, Results for: ds3#
Output Fs : 44,100Hz#
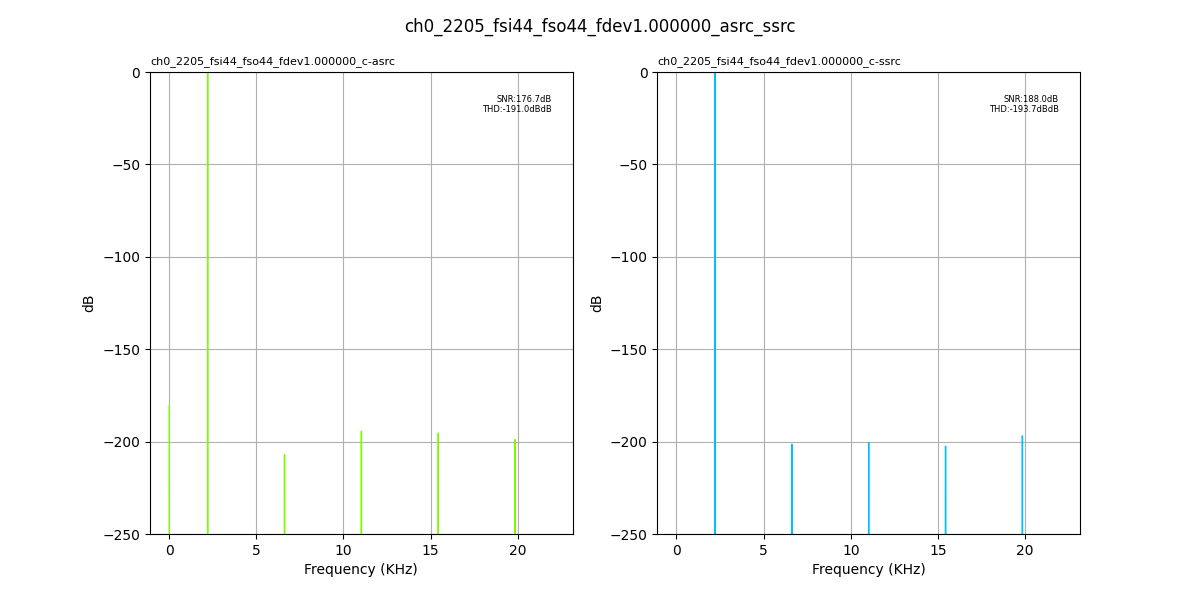
Fig. 87 Input Fs: 44,100Hz, Output Fs: 44,100Hz, Fs error: 1.000000, Results for: asrc, ssrc#
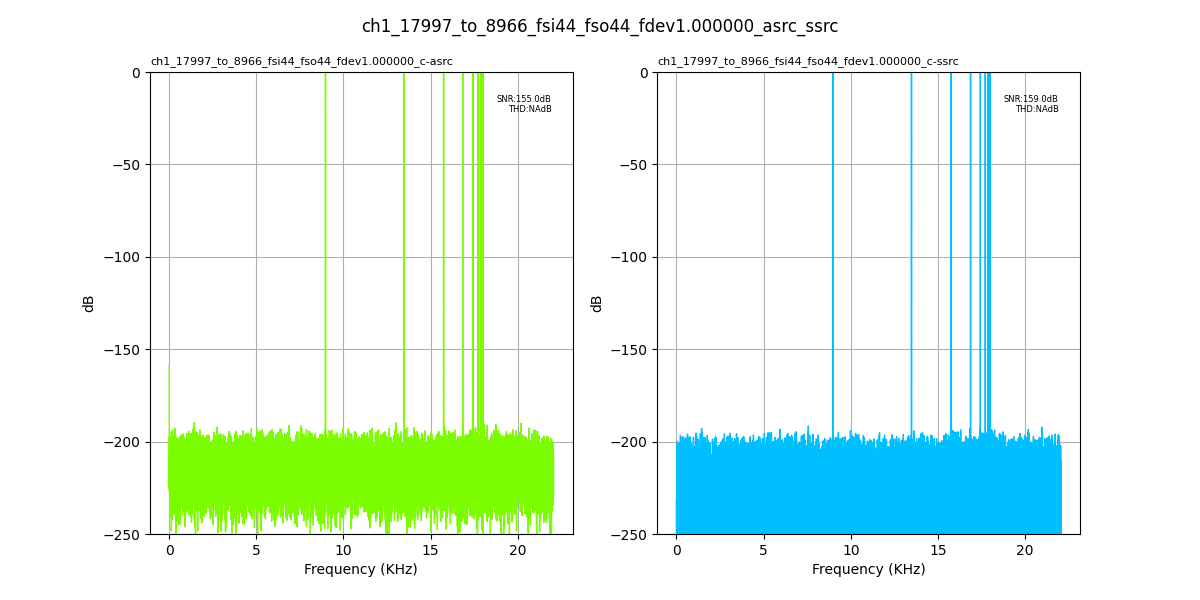
Fig. 88 Input Fs: 44,100Hz, Output Fs: 44,100Hz, Fs error: 1.000000, Results for: asrc, ssrc#
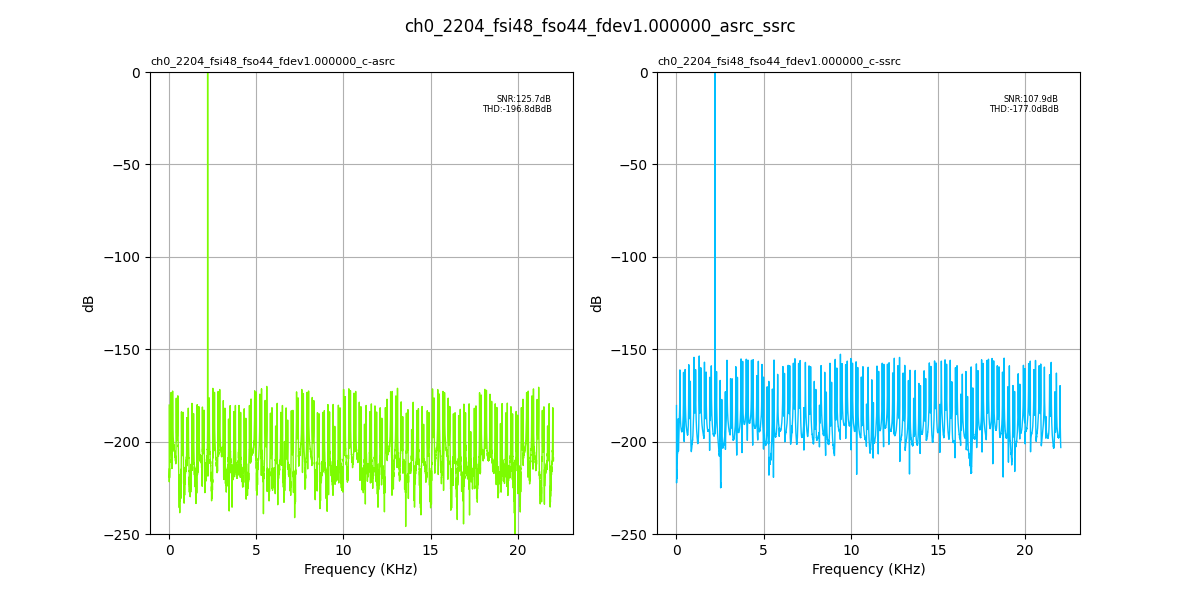
Fig. 89 Input Fs: 48,000Hz, Output Fs: 44,100Hz, Fs error: 1.000000, Results for: asrc, ssrc#
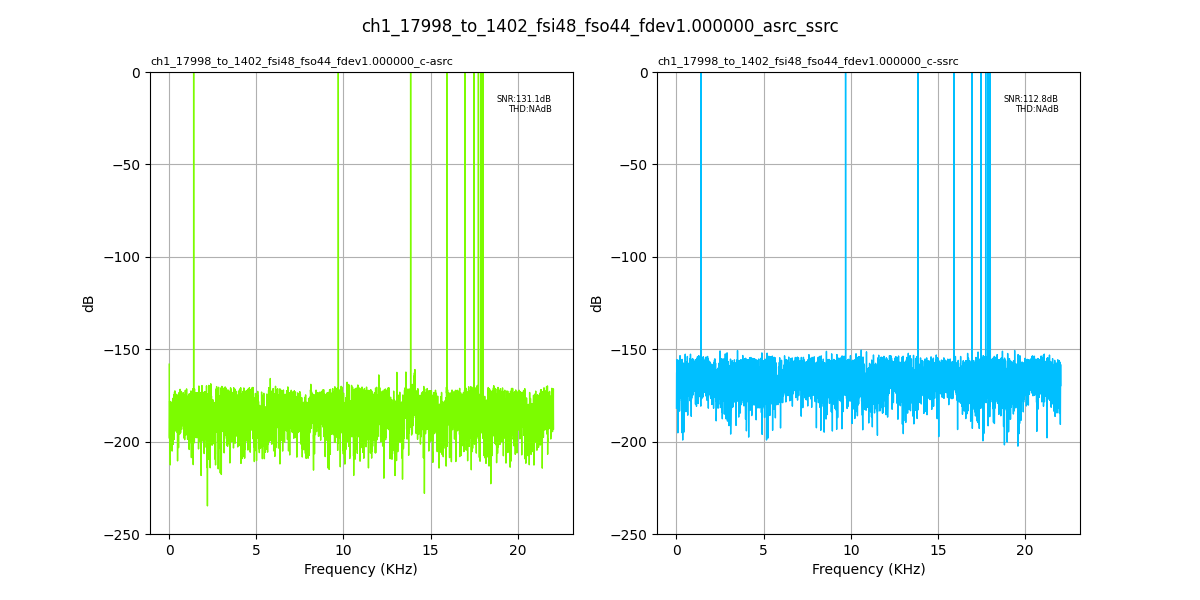
Fig. 90 Input Fs: 48,000Hz, Output Fs: 44,100Hz, Fs error: 1.000000, Results for: asrc, ssrc#
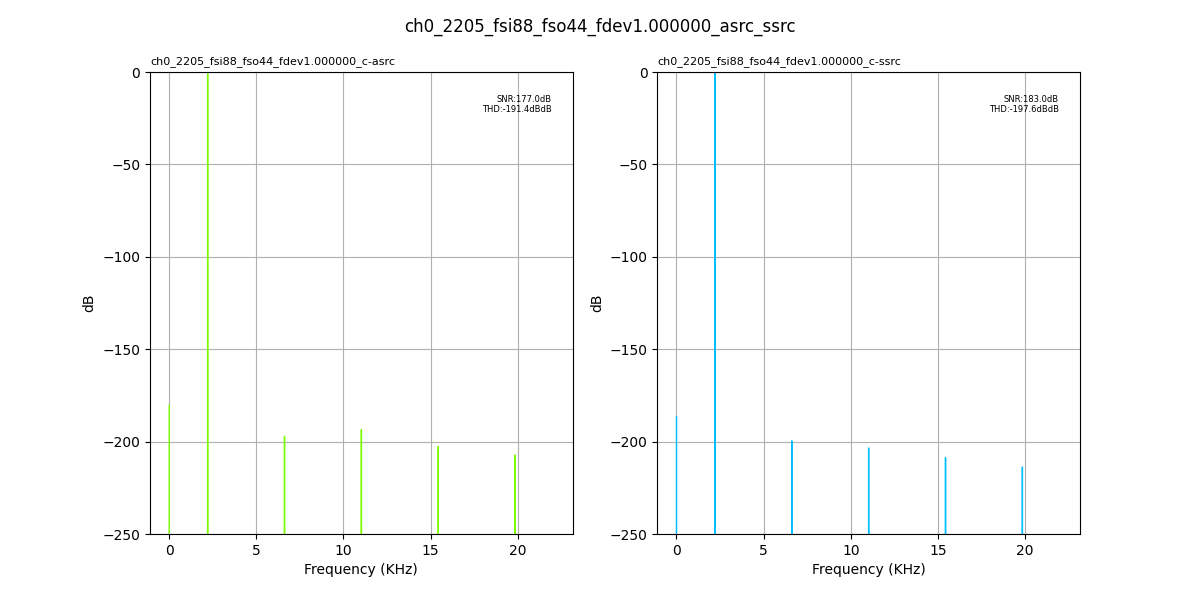
Fig. 91 Input Fs: 88,200Hz, Output Fs: 44,100Hz, Fs error: 1.000000, Results for: asrc, ssrc#
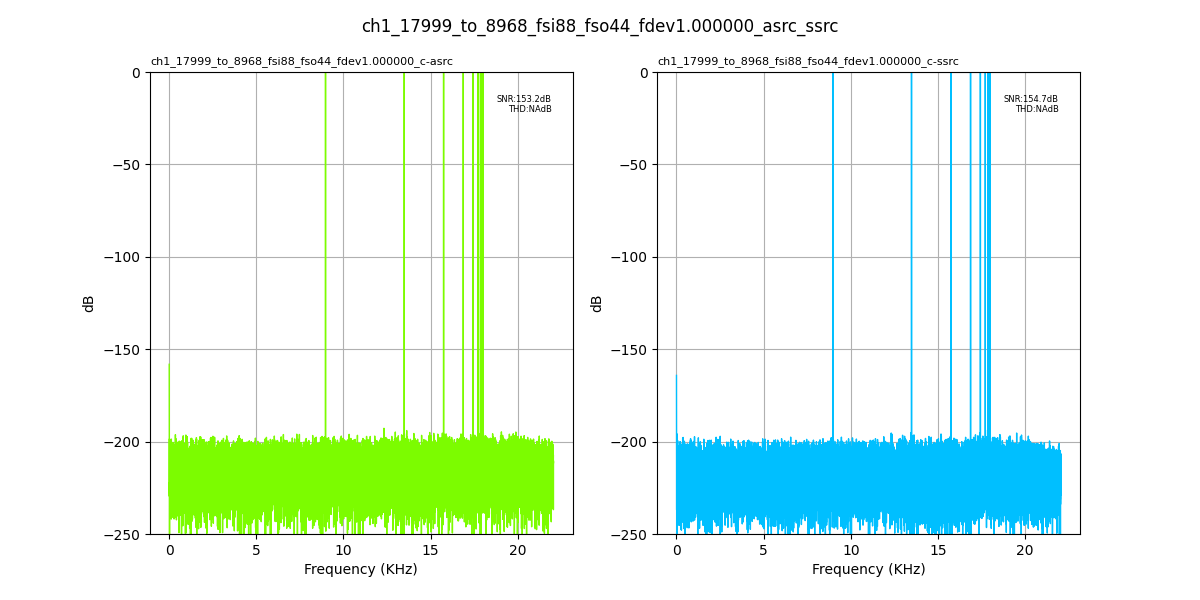
Fig. 92 Input Fs: 88,200Hz, Output Fs: 44,100Hz, Fs error: 1.000000, Results for: asrc, ssrc#
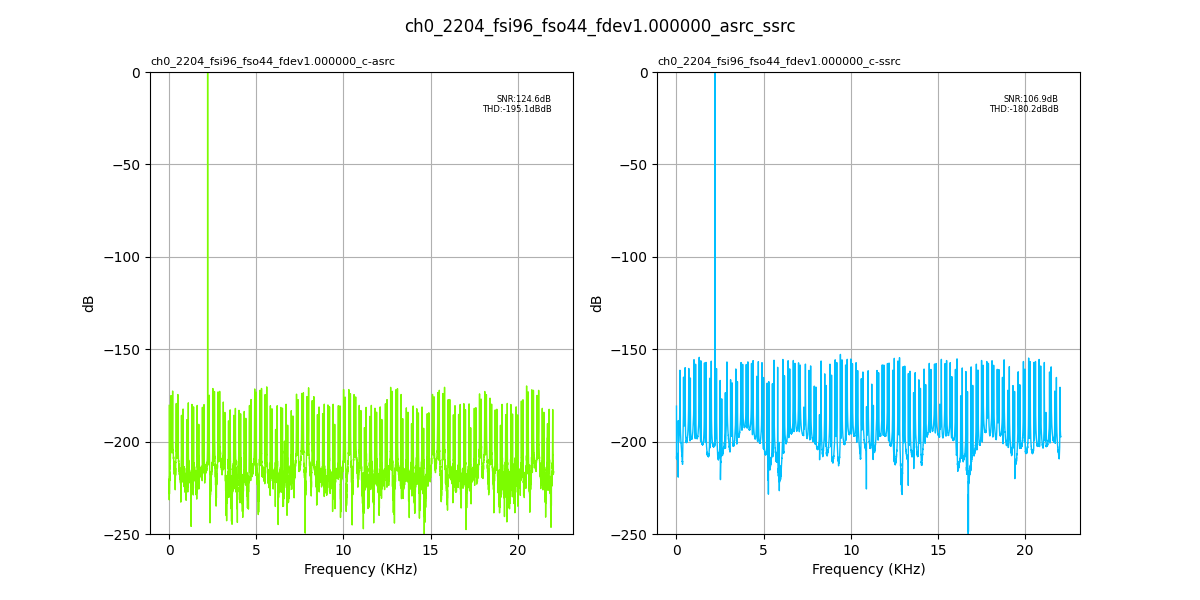
Fig. 93 Input Fs: 96,000Hz, Output Fs: 44,100Hz, Fs error: 1.000000, Results for: asrc, ssrc#
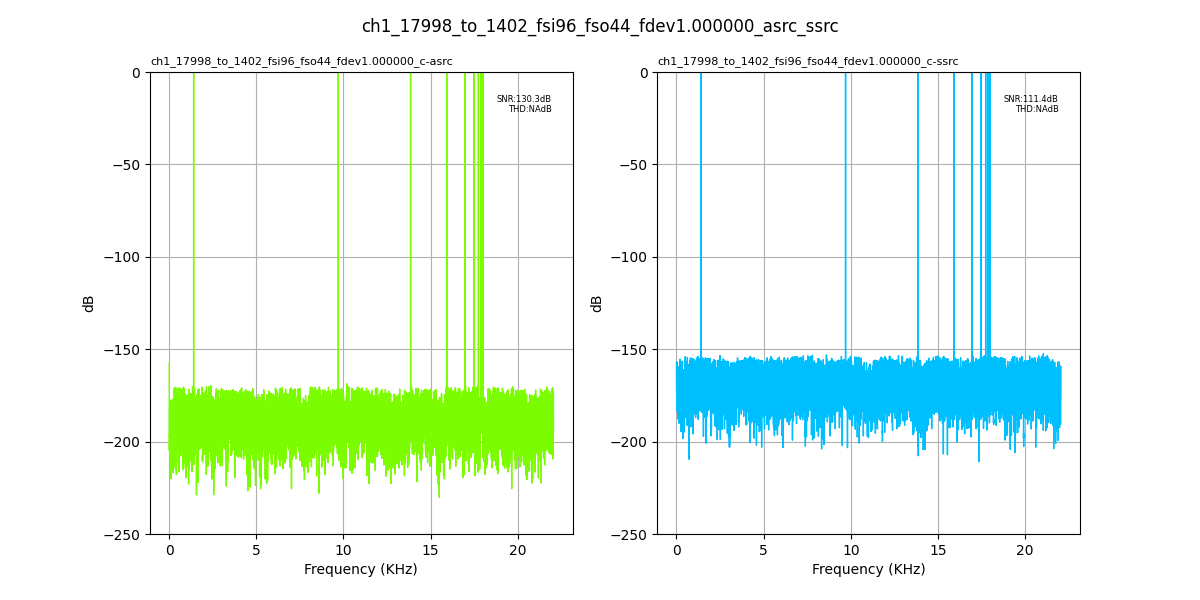
Fig. 94 Input Fs: 96,000Hz, Output Fs: 44,100Hz, Fs error: 1.000000, Results for: asrc, ssrc#
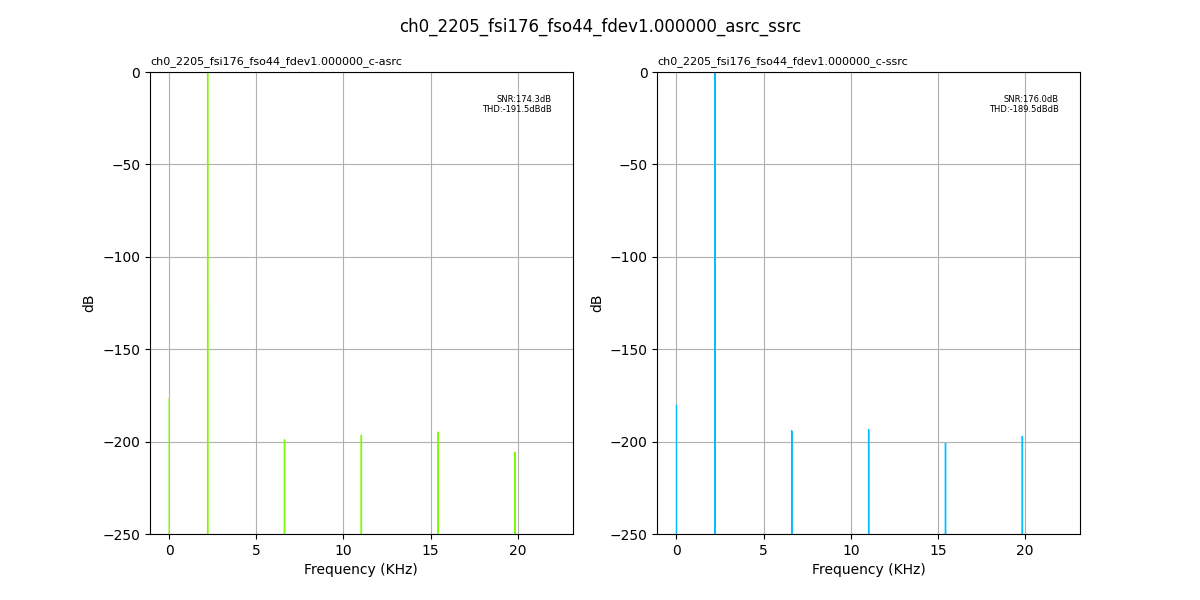
Fig. 95 Input Fs: 176,400Hz, Output Fs: 44,100Hz, Fs error: 1.000000, Results for: asrc, ssrc#
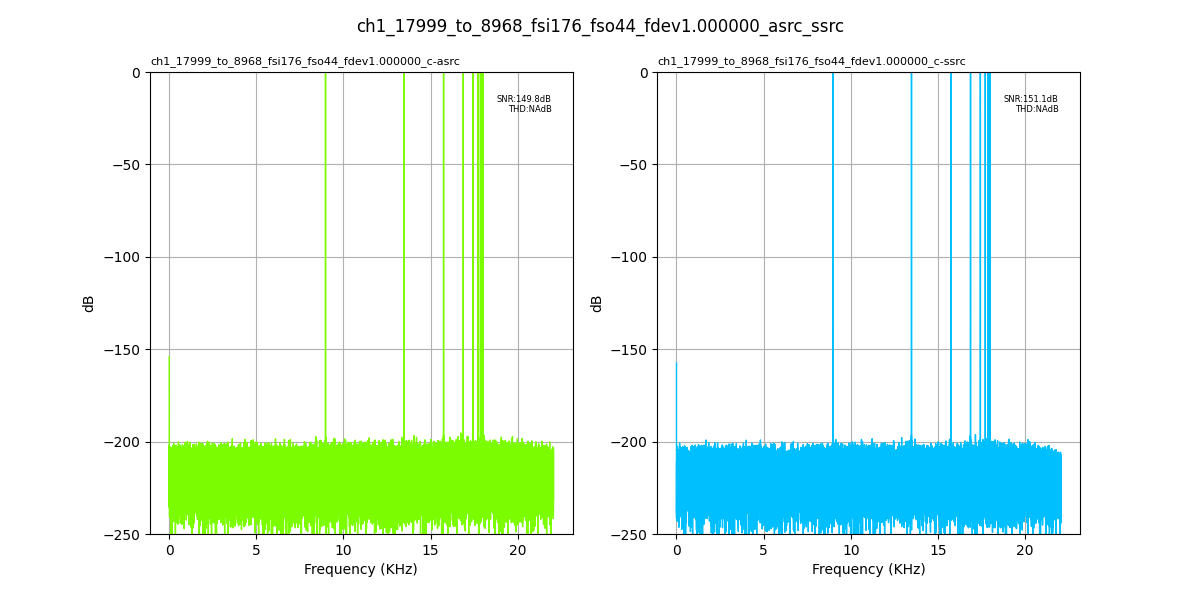
Fig. 96 Input Fs: 176,400Hz, Output Fs: 44,100Hz, Fs error: 1.000000, Results for: asrc, ssrc#
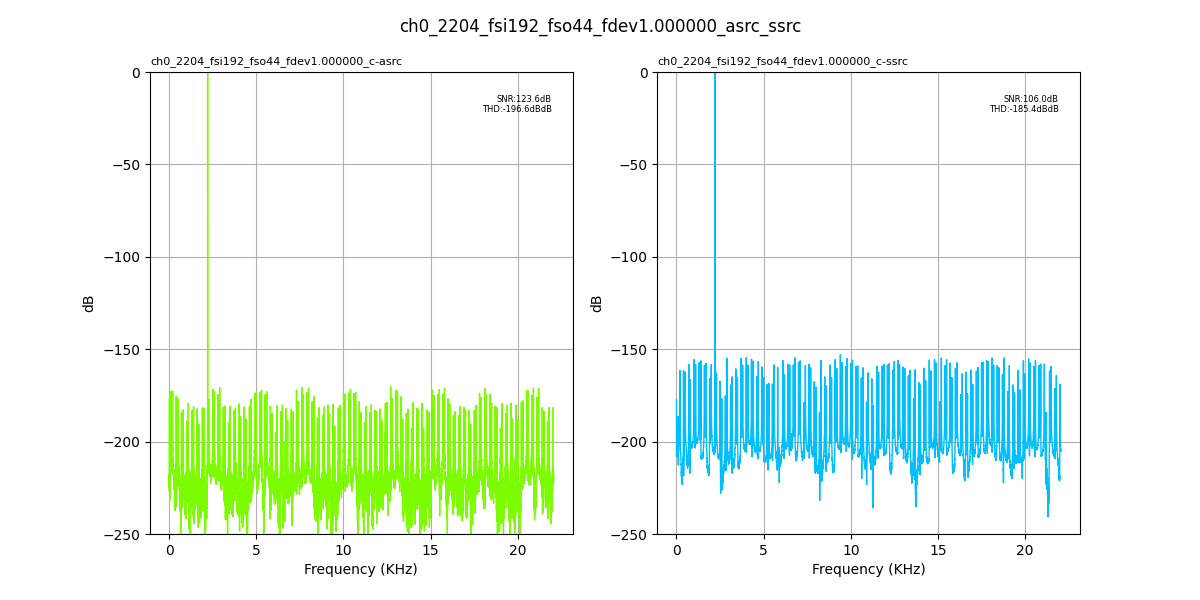
Fig. 97 Input Fs: 192,000Hz, Output Fs: 44,100Hz, Fs error: 1.000000, Results for: asrc, ssrc#
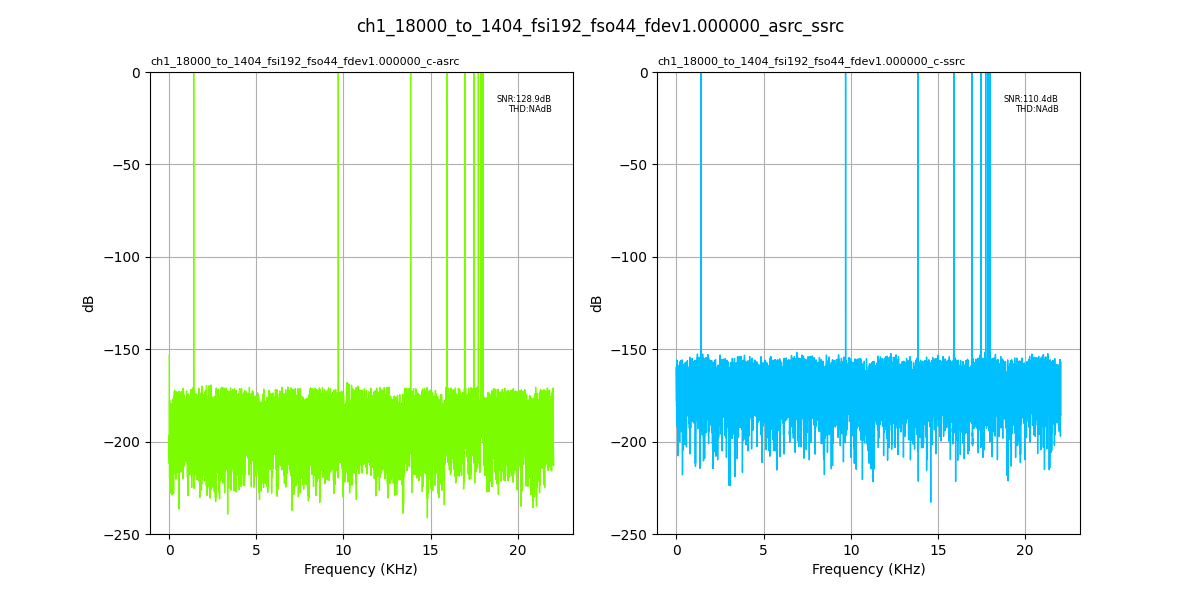
Fig. 98 Input Fs: 192,000Hz, Output Fs: 44,100Hz, Fs error: 1.000000, Results for: asrc, ssrc#
Output Fs : 48,000Hz#
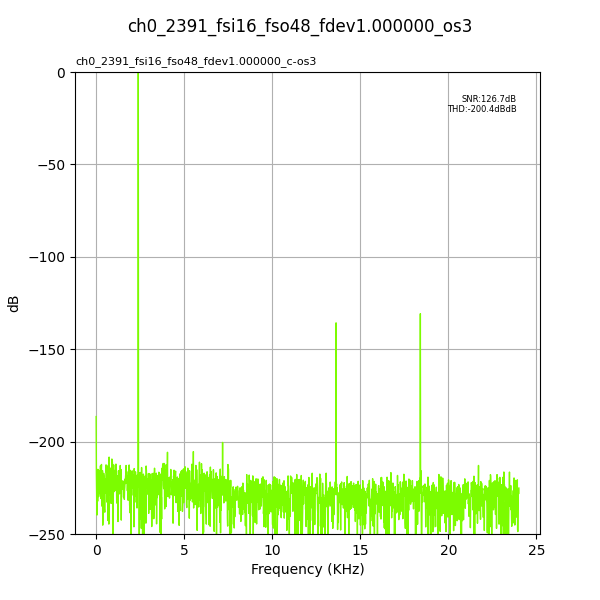
Fig. 99 Input Fs: 16,000Hz, Output Fs: 48,000Hz, Fs error: 1.000000, Results for: os3#
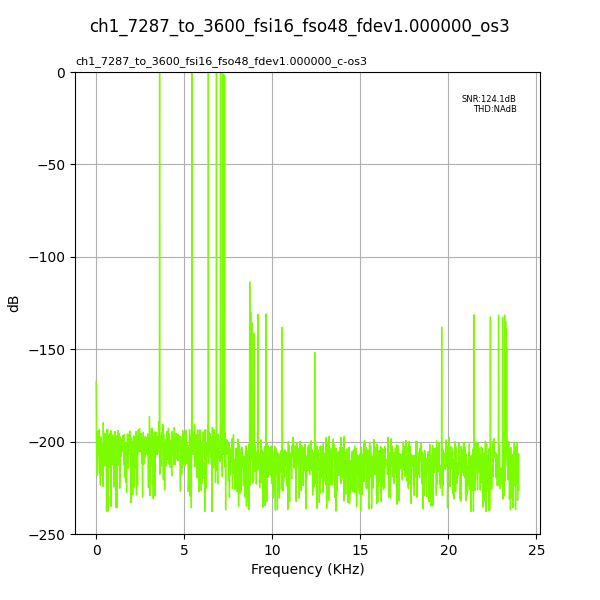
Fig. 100 Input Fs: 16,000Hz, Output Fs: 48,000Hz, Fs error: 1.000000, Results for: os3#
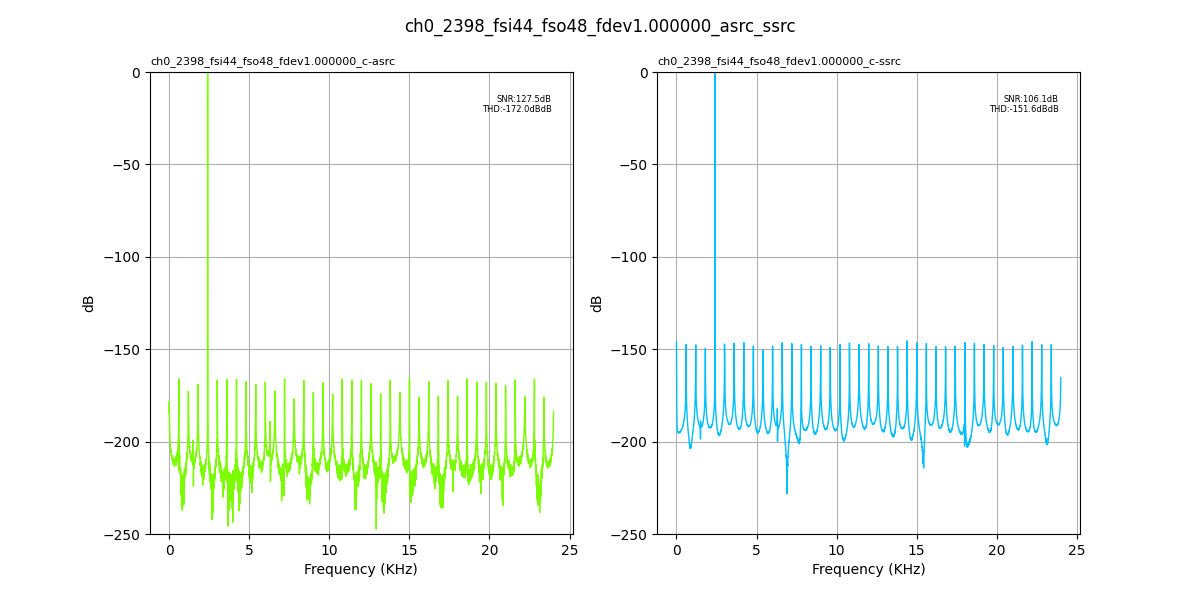
Fig. 101 Input Fs: 44,100Hz, Output Fs: 48,000Hz, Fs error: 1.000000, Results for: asrc, ssrc#
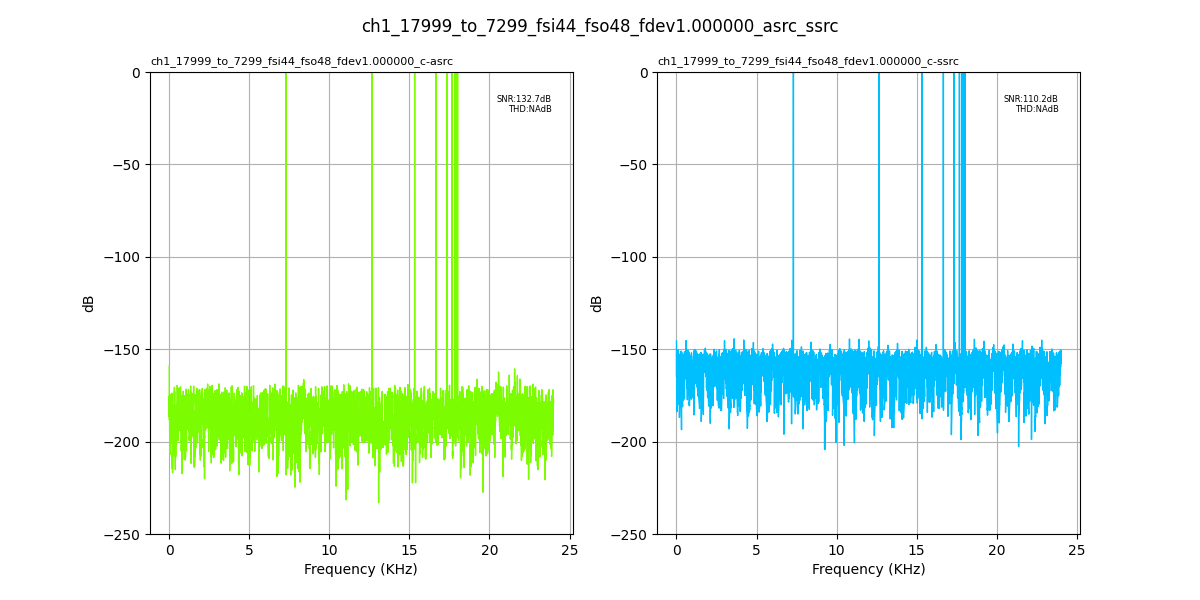
Fig. 102 Input Fs: 44,100Hz, Output Fs: 48,000Hz, Fs error: 1.000000, Results for: asrc, ssrc#
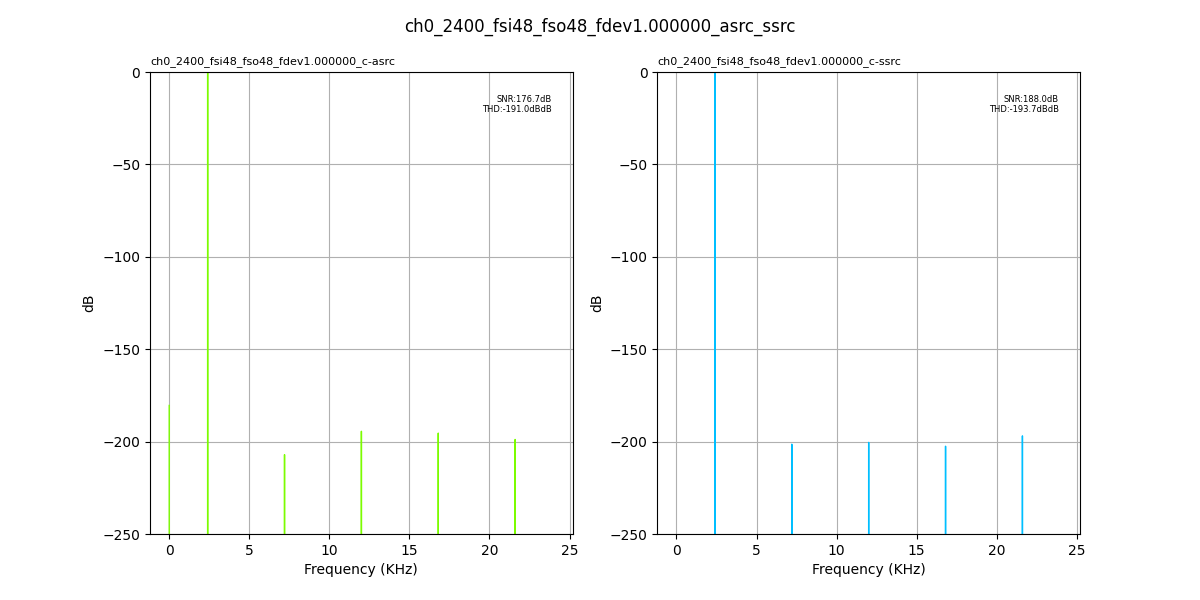
Fig. 103 Input Fs: 48,000Hz, Output Fs: 48,000Hz, Fs error: 1.000000, Results for: asrc, ssrc#
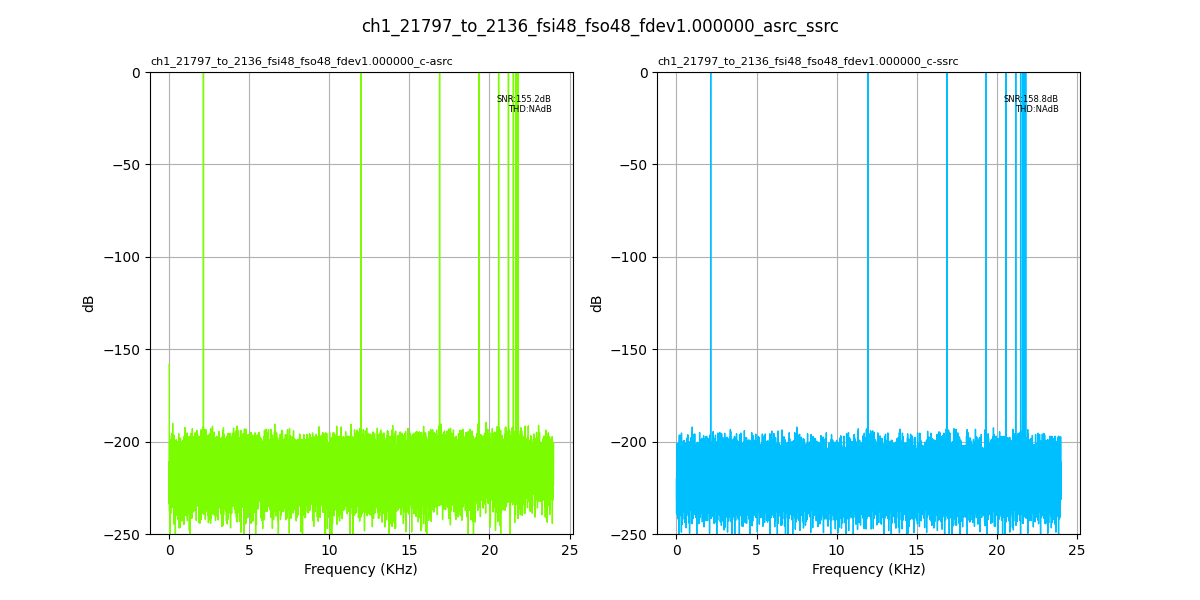
Fig. 104 Input Fs: 48,000Hz, Output Fs: 48,000Hz, Fs error: 1.000000, Results for: asrc, ssrc#
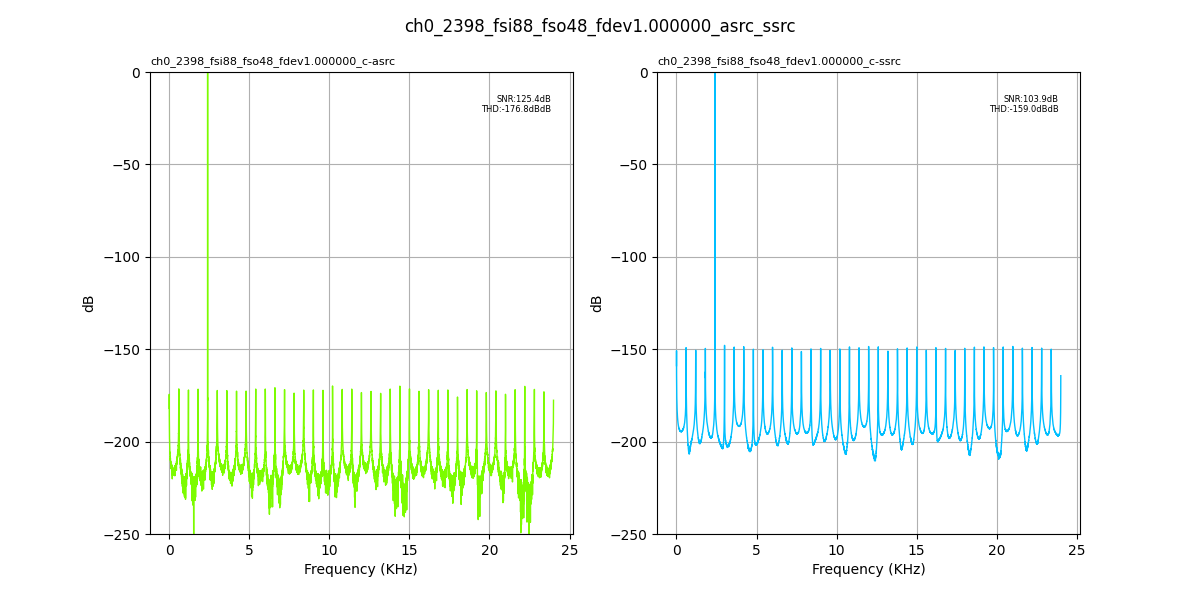
Fig. 105 Input Fs: 88,200Hz, Output Fs: 48,000Hz, Fs error: 1.000000, Results for: asrc, ssrc#
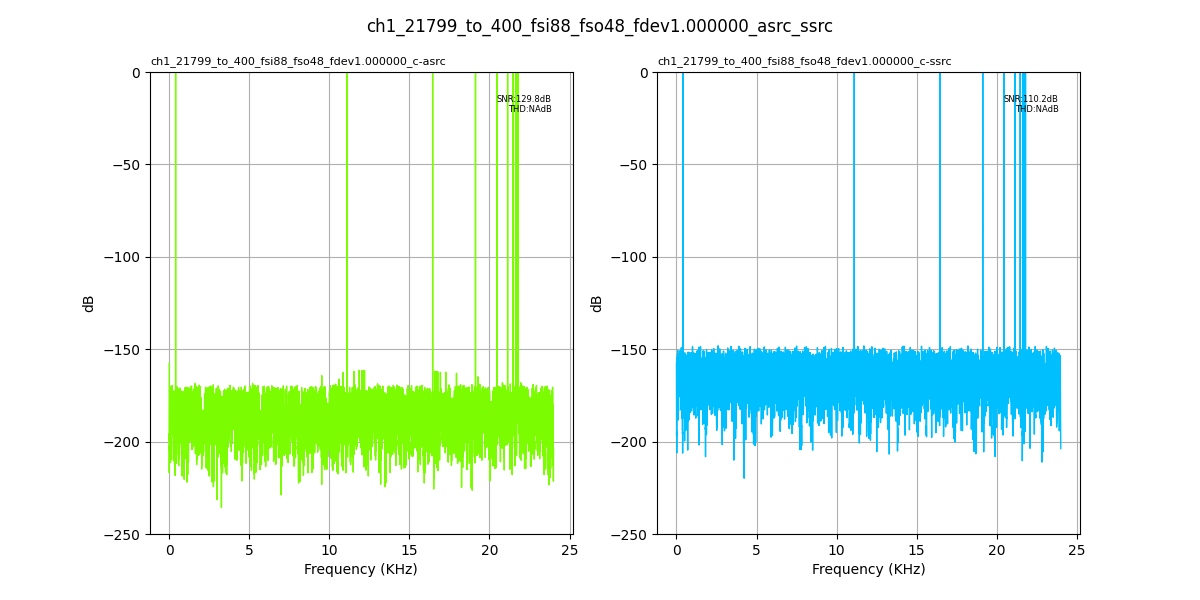
Fig. 106 Input Fs: 88,200Hz, Output Fs: 48,000Hz, Fs error: 1.000000, Results for: asrc, ssrc#
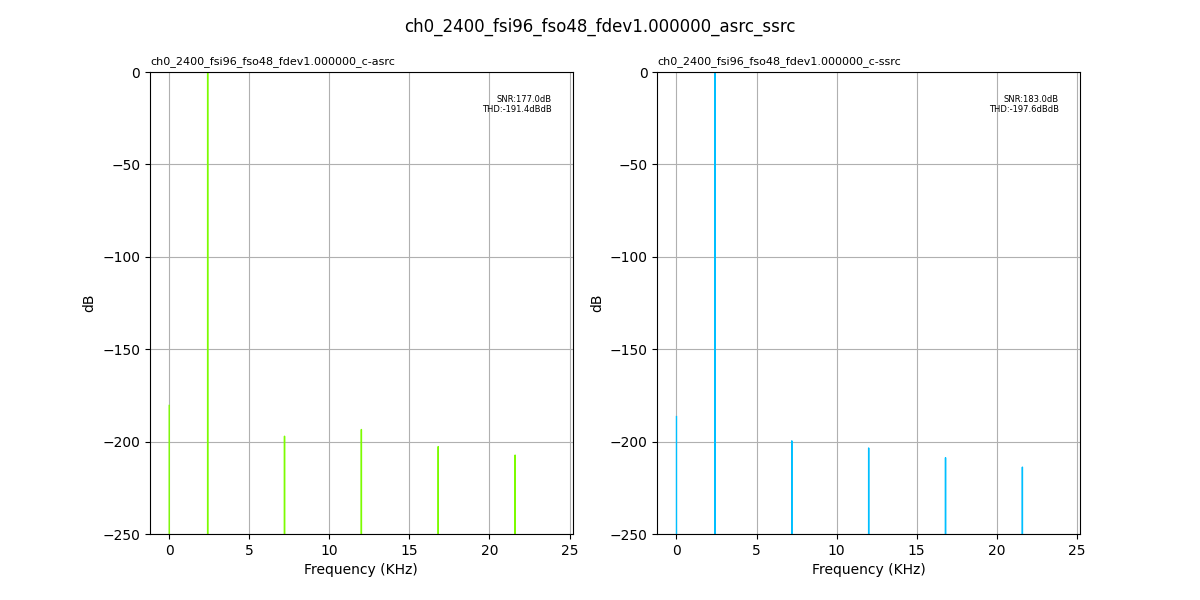
Fig. 107 Input Fs: 96,000Hz, Output Fs: 48,000Hz, Fs error: 1.000000, Results for: asrc, ssrc#
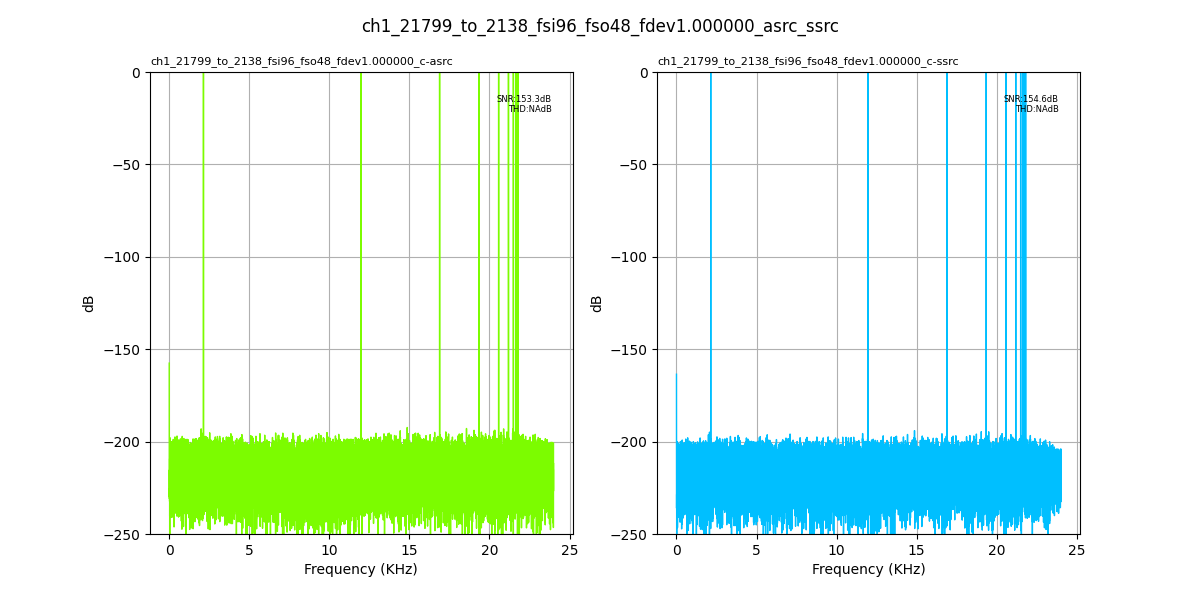
Fig. 108 Input Fs: 96,000Hz, Output Fs: 48,000Hz, Fs error: 1.000000, Results for: asrc, ssrc#
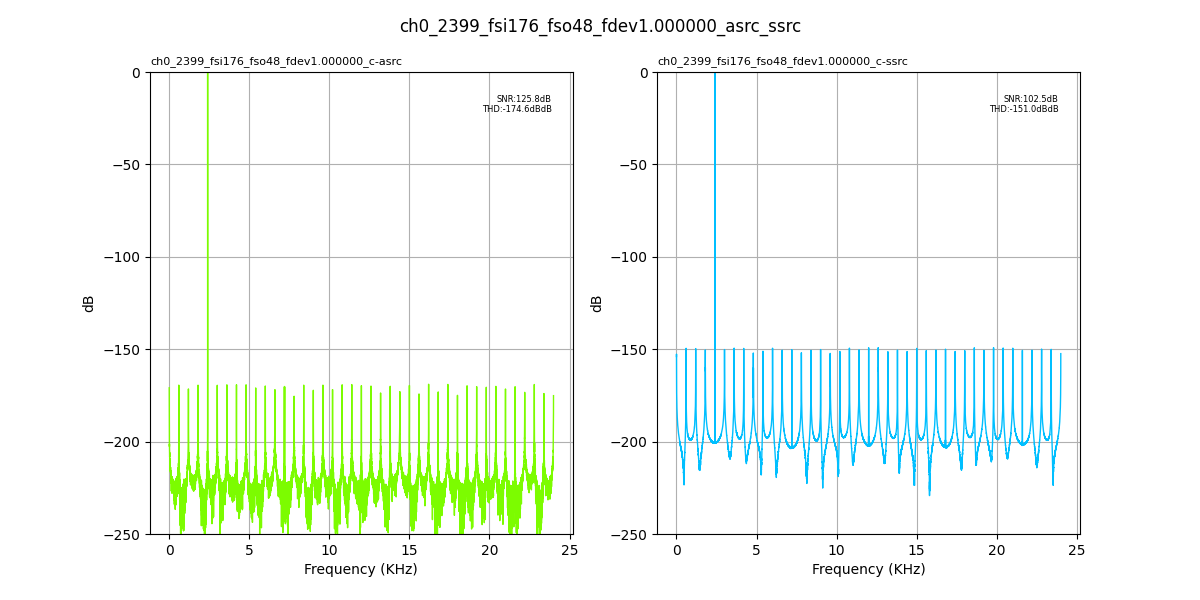
Fig. 109 Input Fs: 176,400Hz, Output Fs: 48,000Hz, Fs error: 1.000000, Results for: asrc, ssrc#
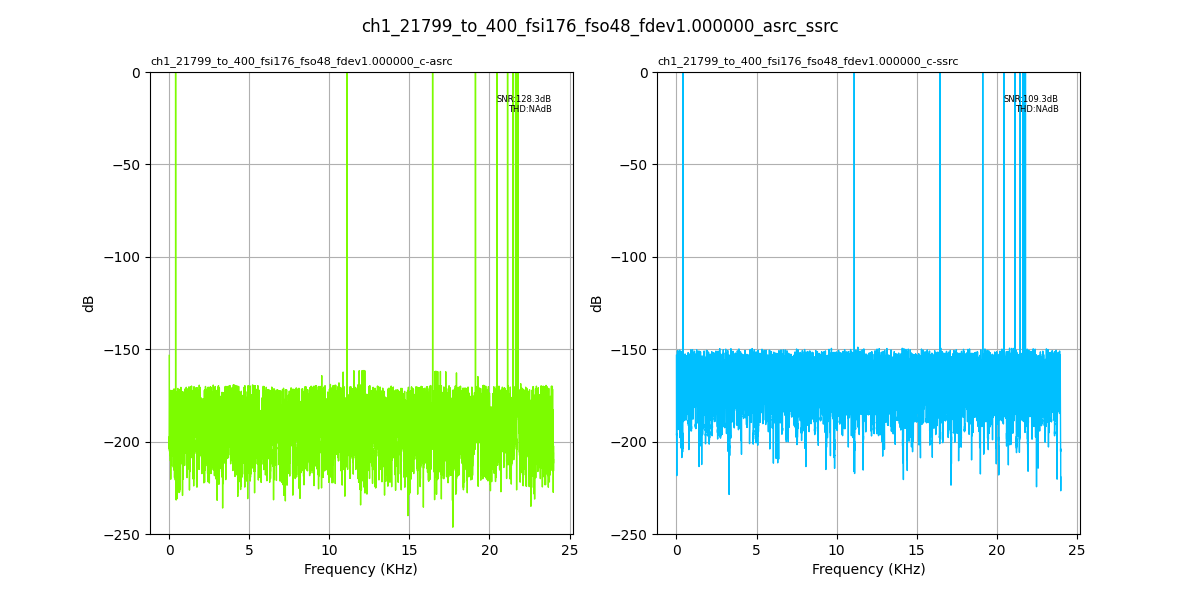
Fig. 110 Input Fs: 176,400Hz, Output Fs: 48,000Hz, Fs error: 1.000000, Results for: asrc, ssrc#
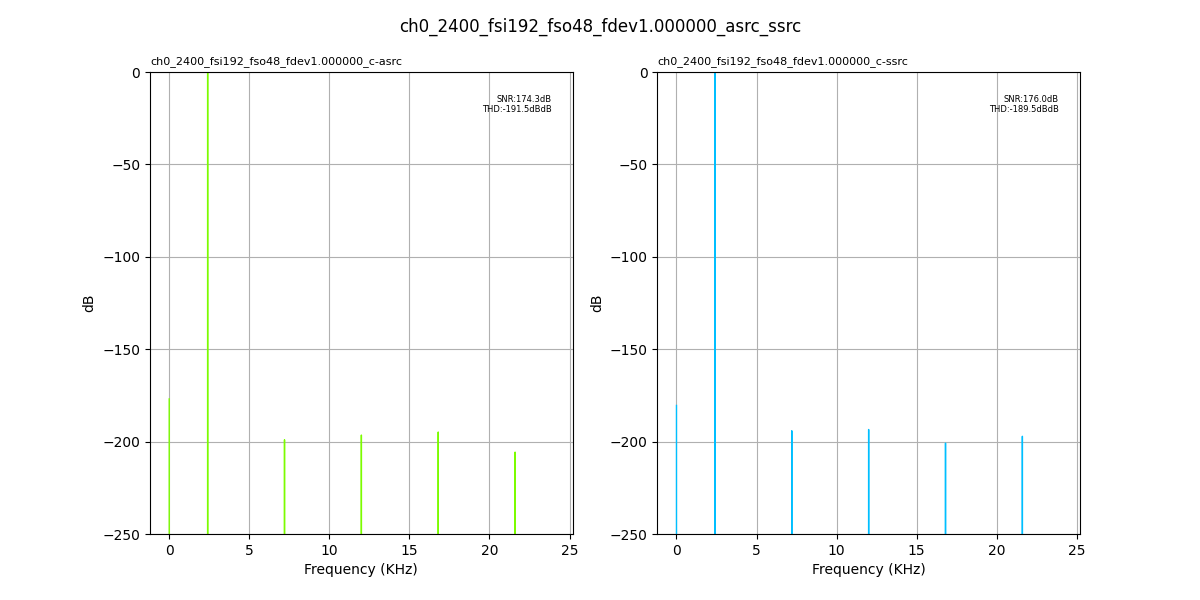
Fig. 111 Input Fs: 192,000Hz, Output Fs: 48,000Hz, Fs error: 1.000000, Results for: asrc, ssrc#
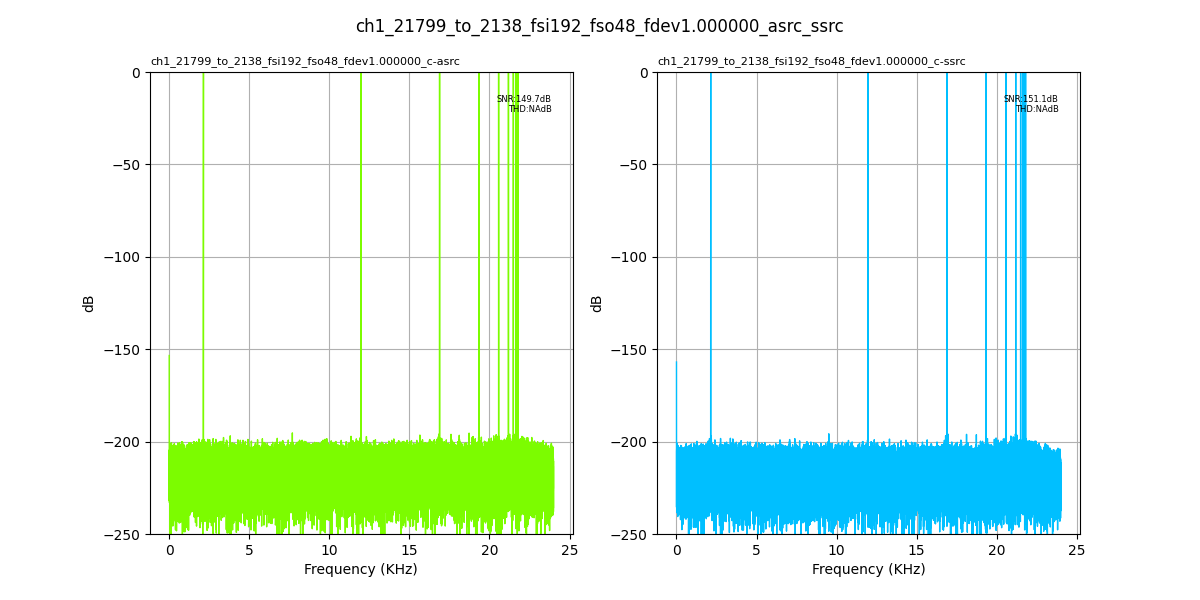
Fig. 112 Input Fs: 192,000Hz, Output Fs: 48,000Hz, Fs error: 1.000000, Results for: asrc, ssrc#
Output Fs : 88,200Hz#
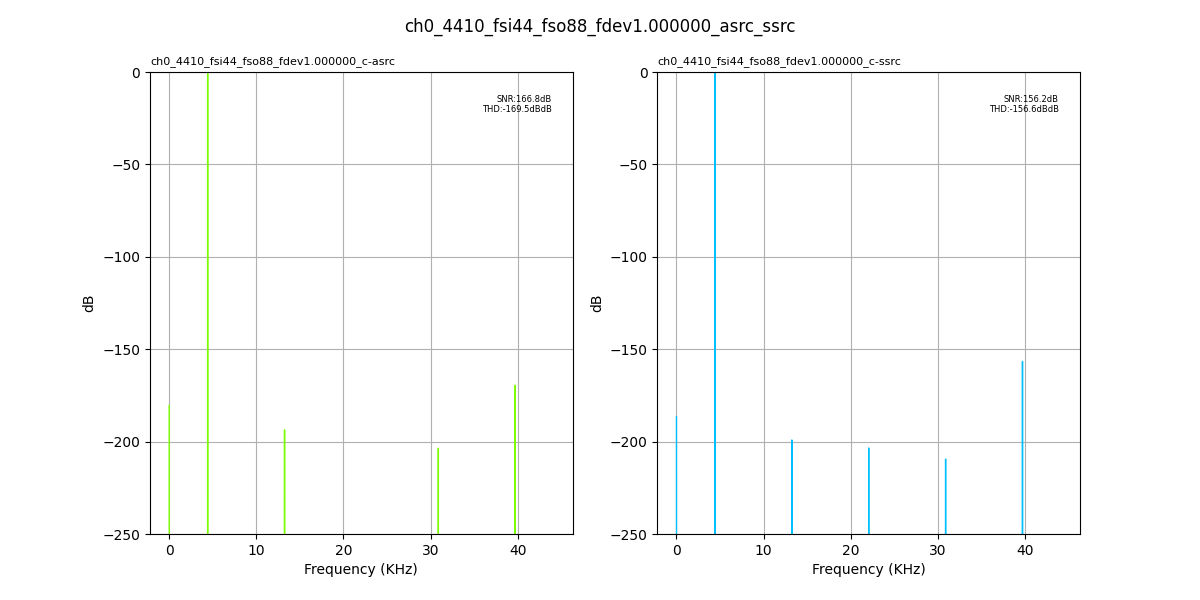
Fig. 113 Input Fs: 44,100Hz, Output Fs: 88,200Hz, Fs error: 1.000000, Results for: asrc, ssrc#
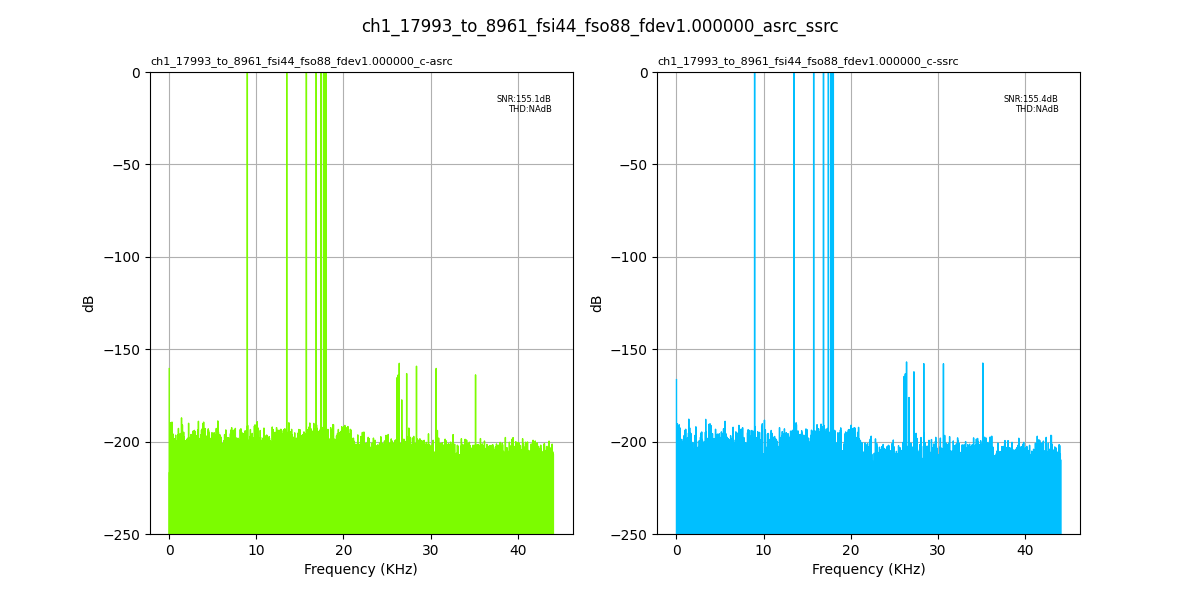
Fig. 114 Input Fs: 44,100Hz, Output Fs: 88,200Hz, Fs error: 1.000000, Results for: asrc, ssrc#
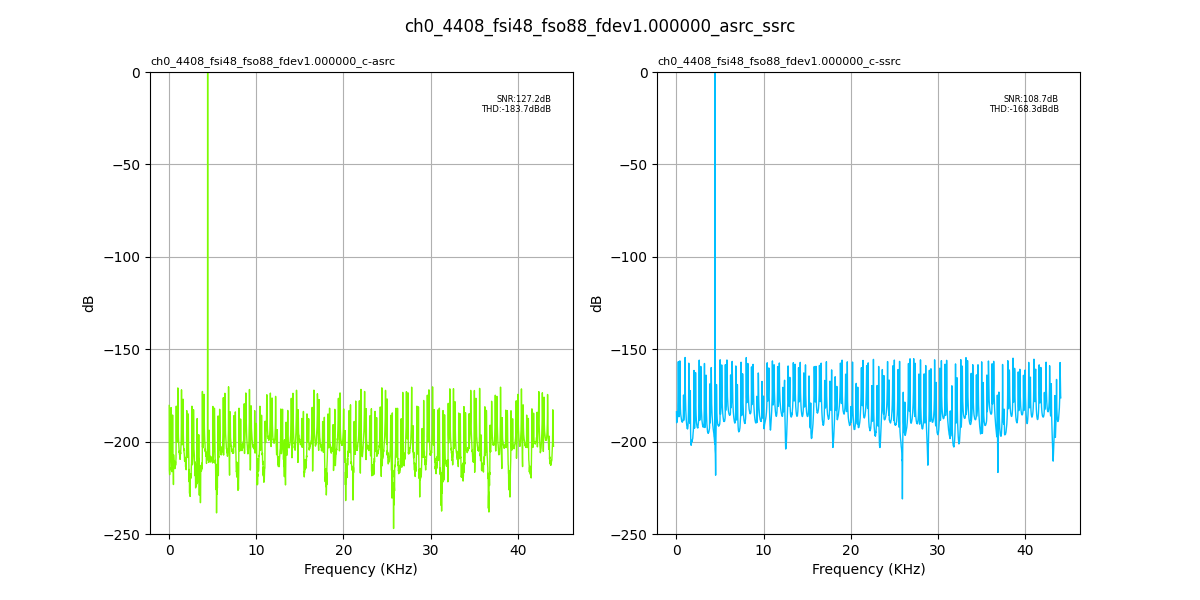
Fig. 115 Input Fs: 48,000Hz, Output Fs: 88,200Hz, Fs error: 1.000000, Results for: asrc, ssrc#
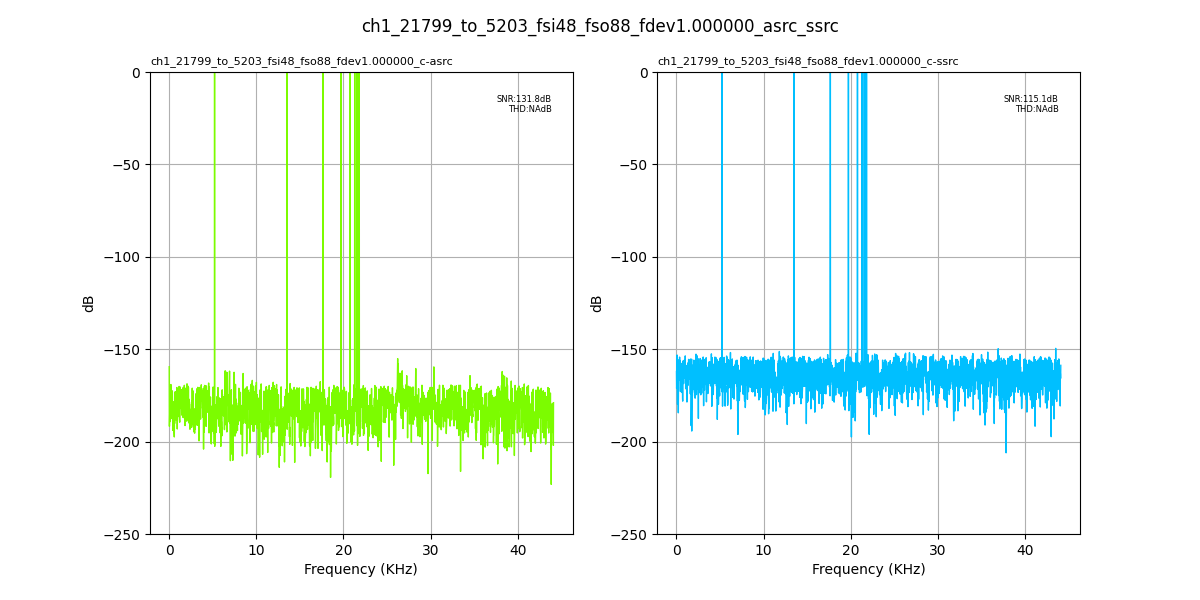
Fig. 116 Input Fs: 48,000Hz, Output Fs: 88,200Hz, Fs error: 1.000000, Results for: asrc, ssrc#
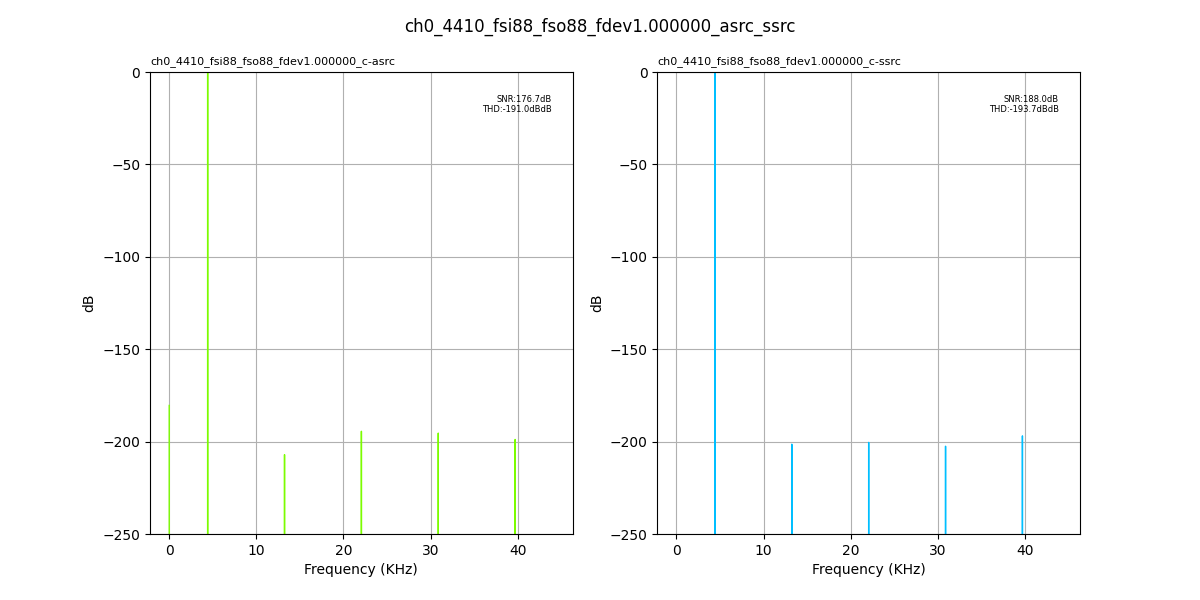
Fig. 117 Input Fs: 88,200Hz, Output Fs: 88,200Hz, Fs error: 1.000000, Results for: asrc, ssrc#
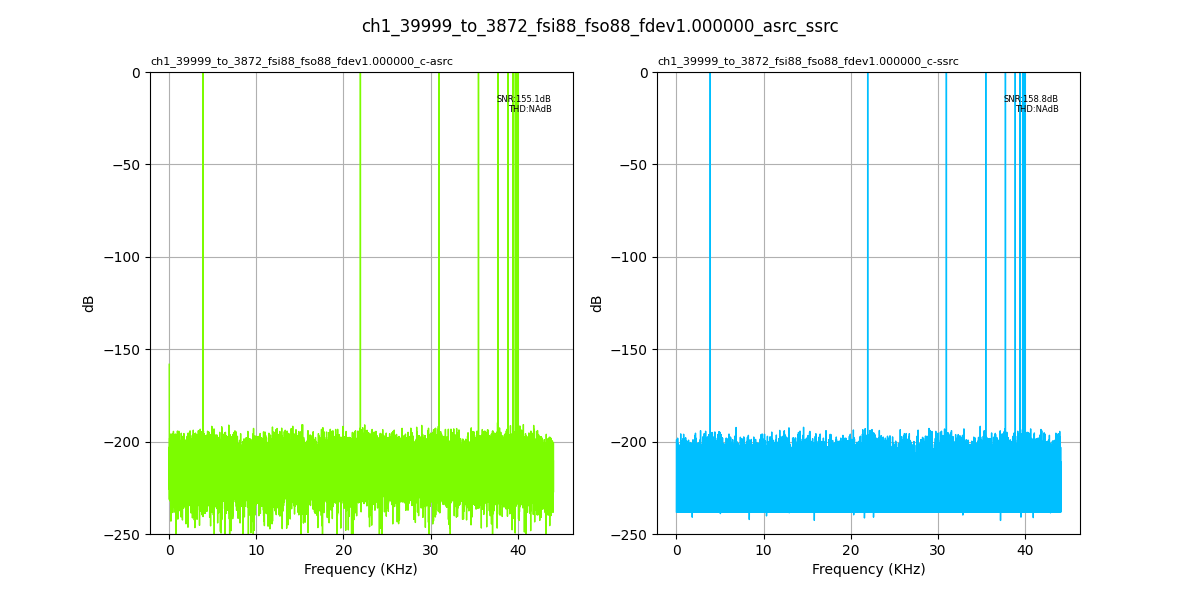
Fig. 118 Input Fs: 88,200Hz, Output Fs: 88,200Hz, Fs error: 1.000000, Results for: asrc, ssrc#
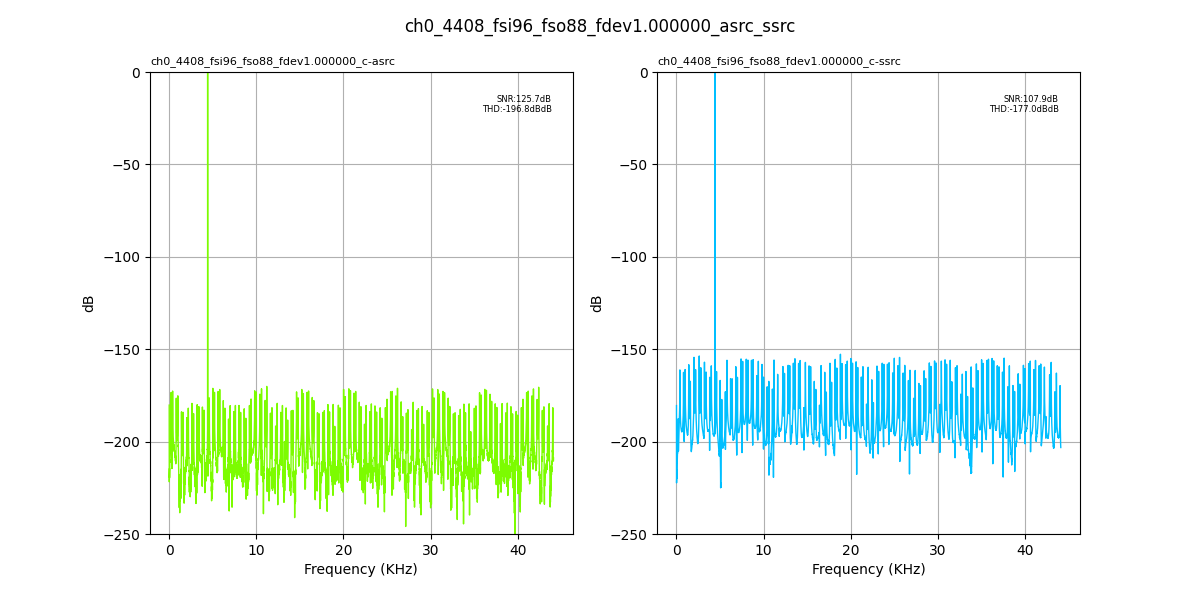
Fig. 119 Input Fs: 96,000Hz, Output Fs: 88,200Hz, Fs error: 1.000000, Results for: asrc, ssrc#
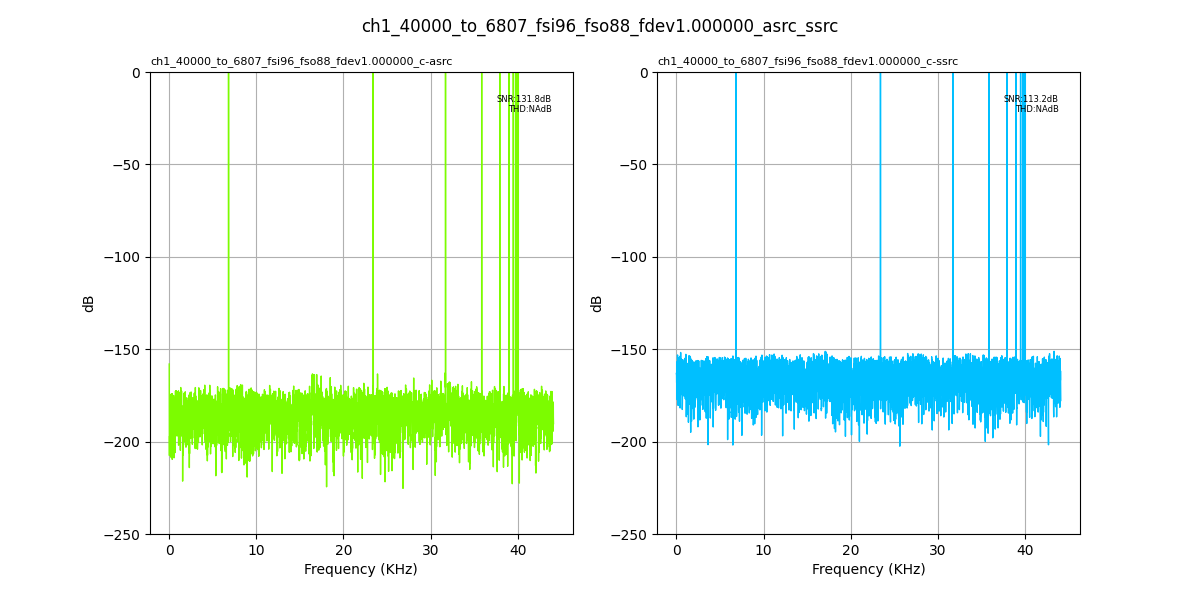
Fig. 120 Input Fs: 96,000Hz, Output Fs: 88,200Hz, Fs error: 1.000000, Results for: asrc, ssrc#
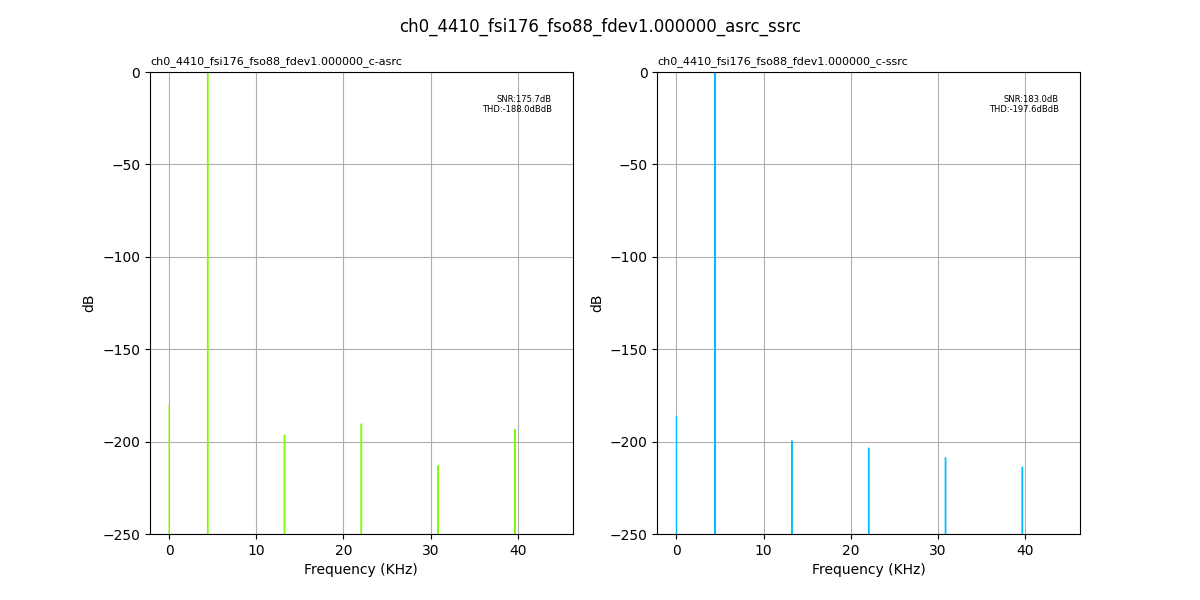
Fig. 121 Input Fs: 176,400Hz, Output Fs: 88,200Hz, Fs error: 1.000000, Results for: asrc, ssrc#
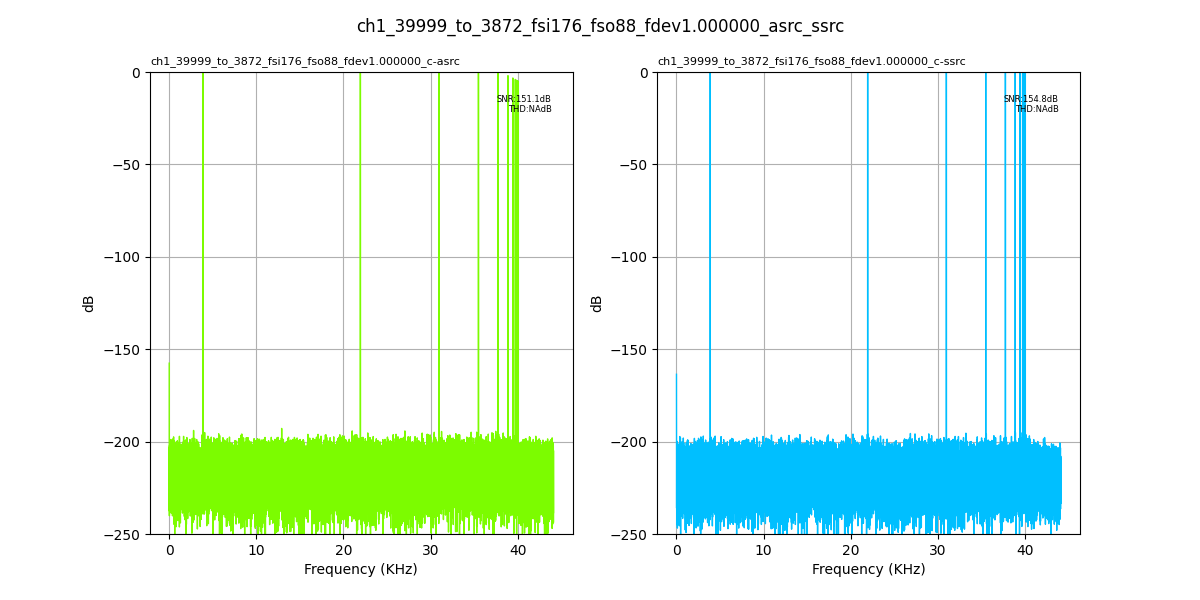
Fig. 122 Input Fs: 176,400Hz, Output Fs: 88,200Hz, Fs error: 1.000000, Results for: asrc, ssrc#
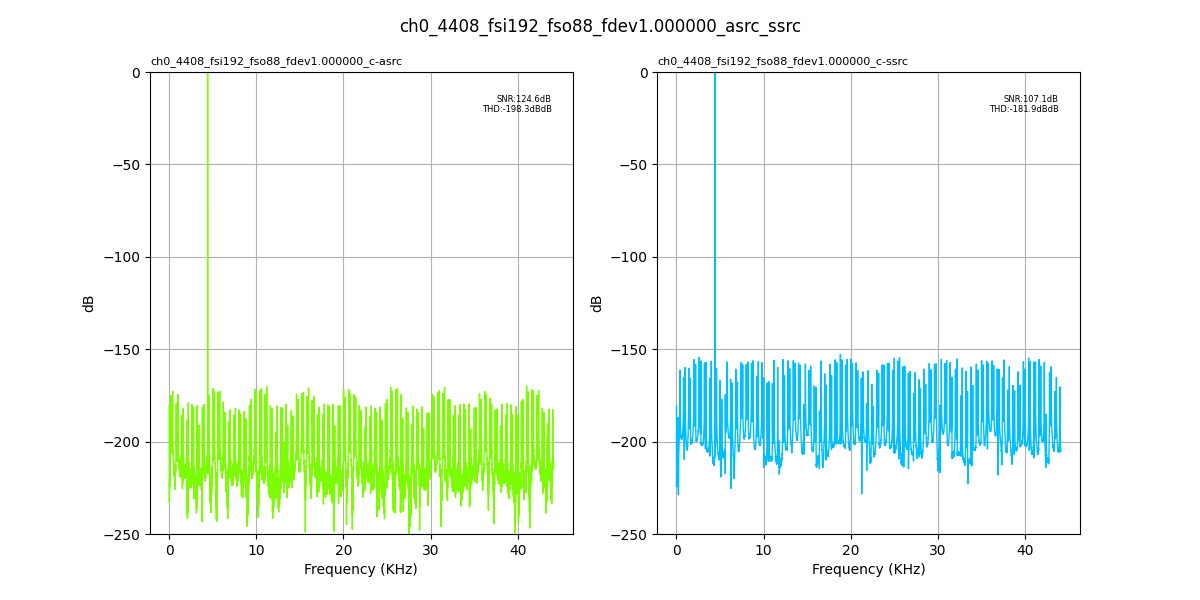
Fig. 123 Input Fs: 192,000Hz, Output Fs: 88,200Hz, Fs error: 1.000000, Results for: asrc, ssrc#
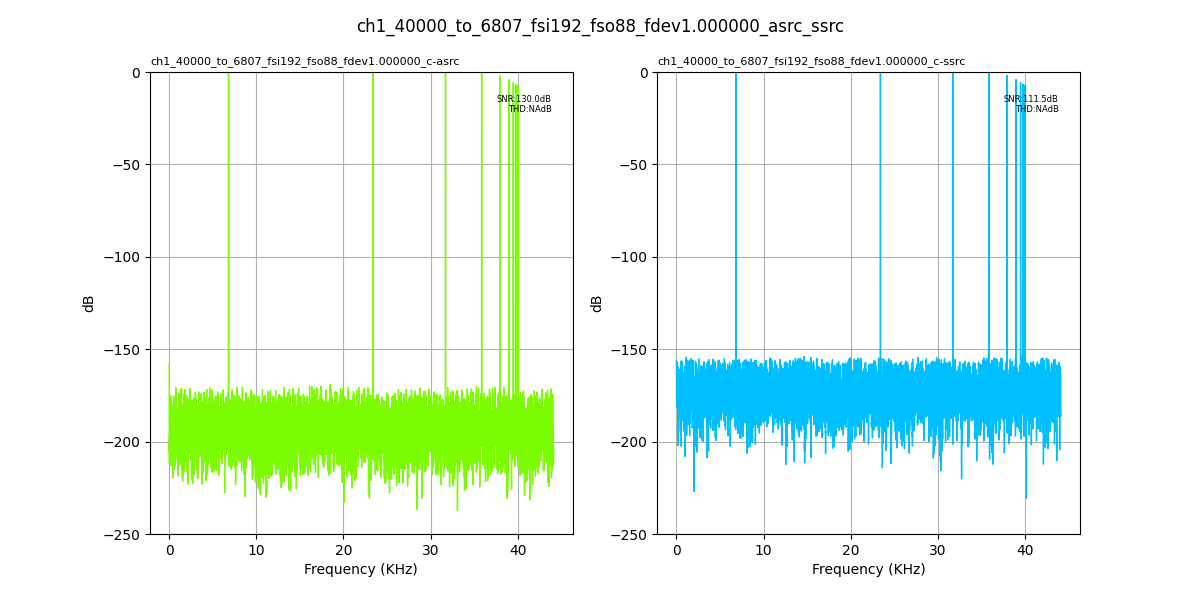
Fig. 124 Input Fs: 192,000Hz, Output Fs: 88,200Hz, Fs error: 1.000000, Results for: asrc, ssrc#
Output Fs : 96,000Hz#
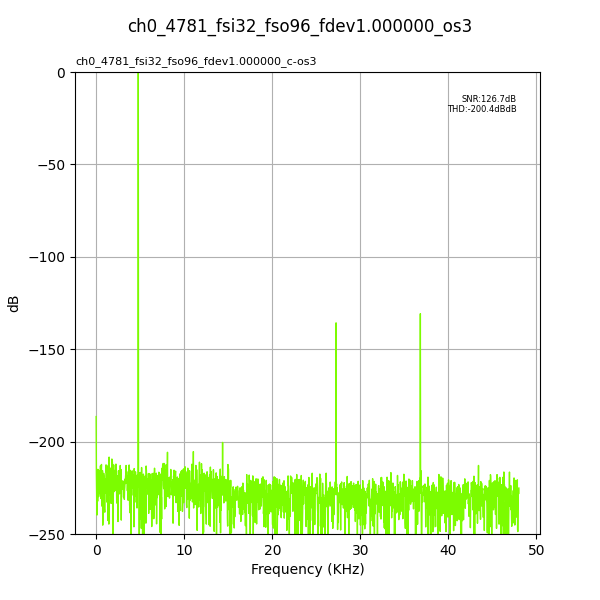
Fig. 125 Input Fs: 32,000Hz, Output Fs: 96,000Hz, Fs error: 1.000000, Results for: os3#
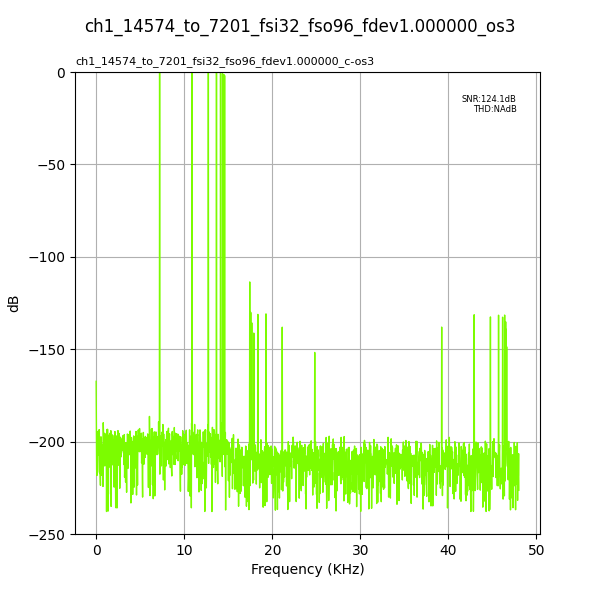
Fig. 126 Input Fs: 32,000Hz, Output Fs: 96,000Hz, Fs error: 1.000000, Results for: os3#
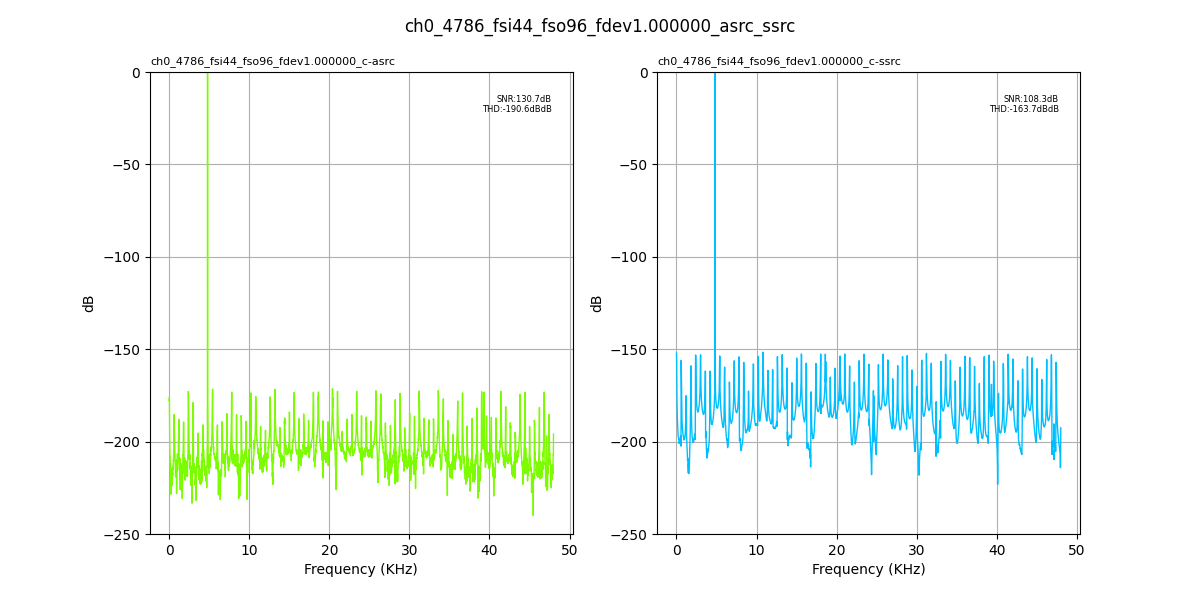
Fig. 127 Input Fs: 44,100Hz, Output Fs: 96,000Hz, Fs error: 1.000000, Results for: asrc, ssrc#
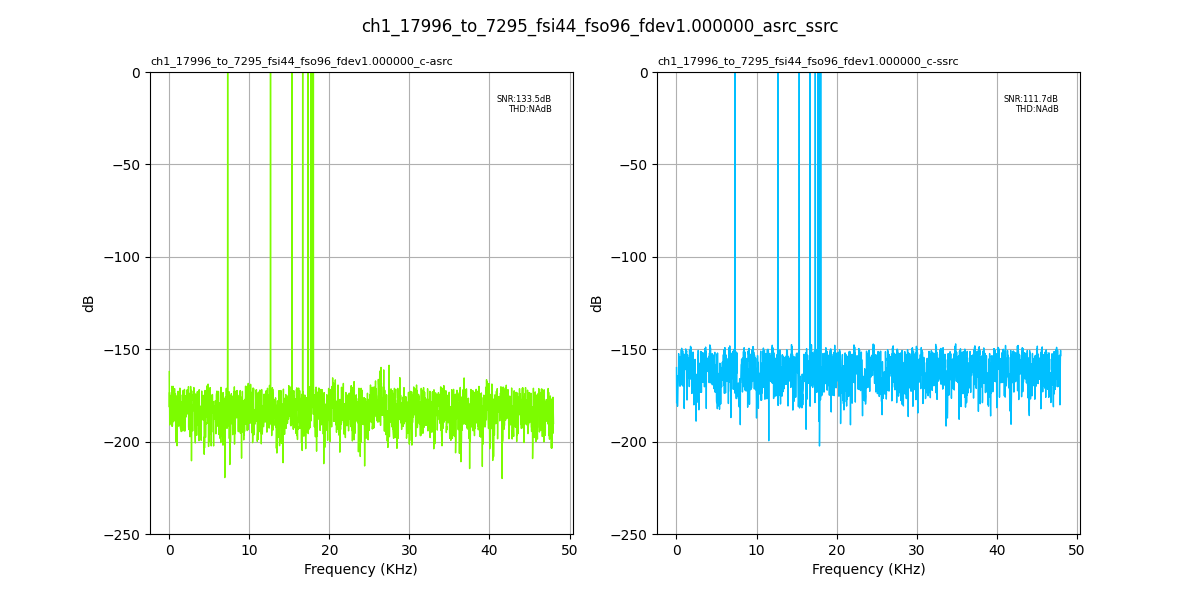
Fig. 128 Input Fs: 44,100Hz, Output Fs: 96,000Hz, Fs error: 1.000000, Results for: asrc, ssrc#
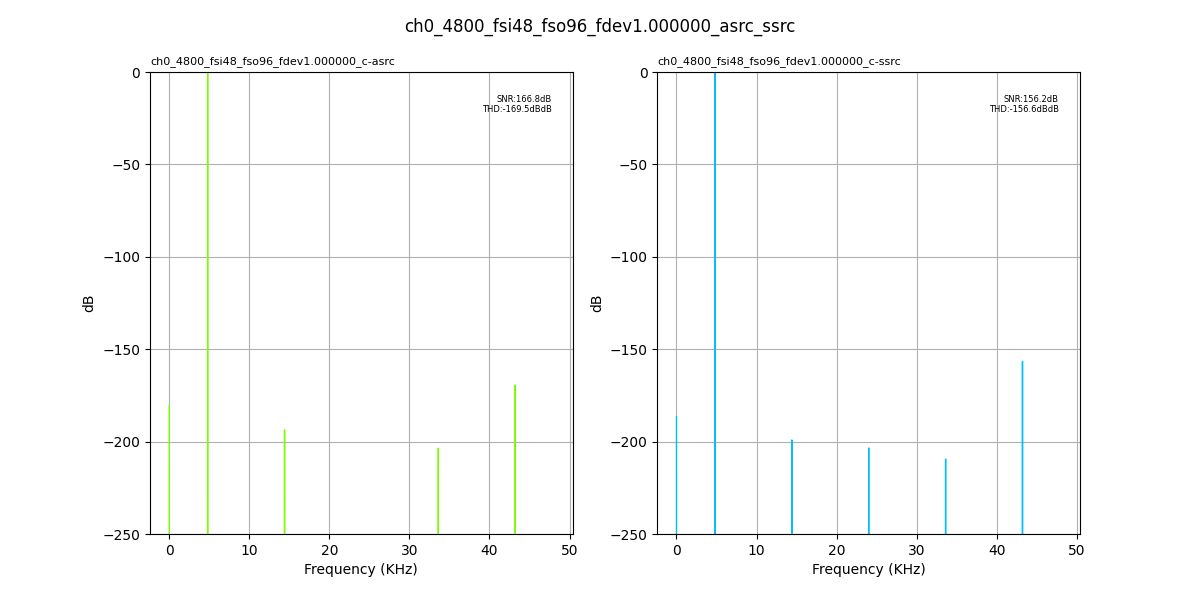
Fig. 129 Input Fs: 48,000Hz, Output Fs: 96,000Hz, Fs error: 1.000000, Results for: asrc, ssrc#
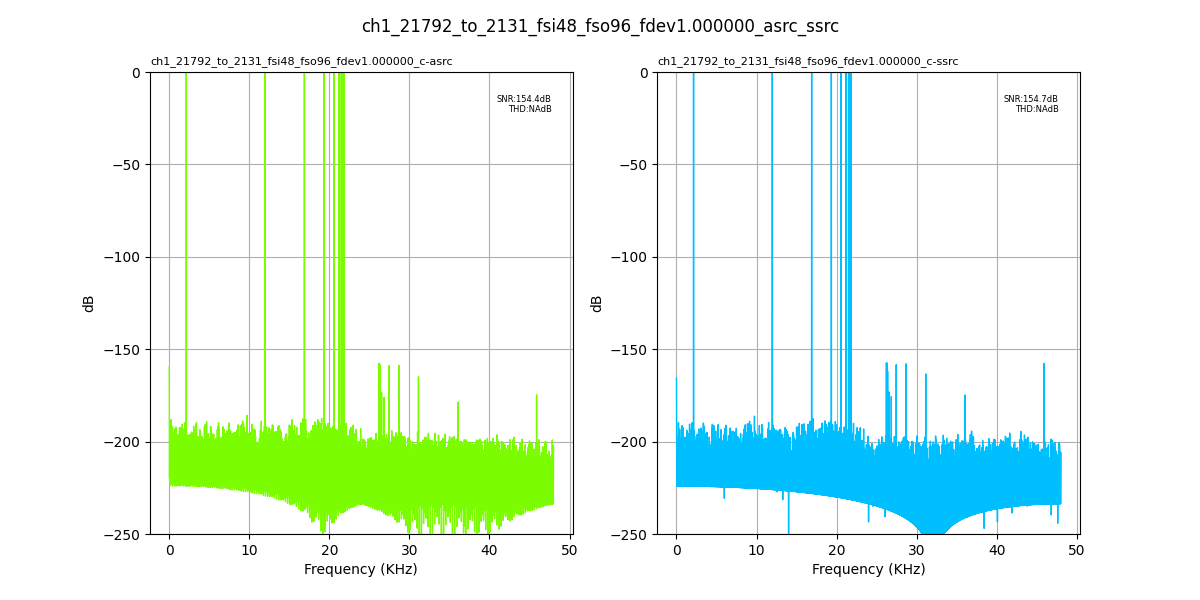
Fig. 130 Input Fs: 48,000Hz, Output Fs: 96,000Hz, Fs error: 1.000000, Results for: asrc, ssrc#
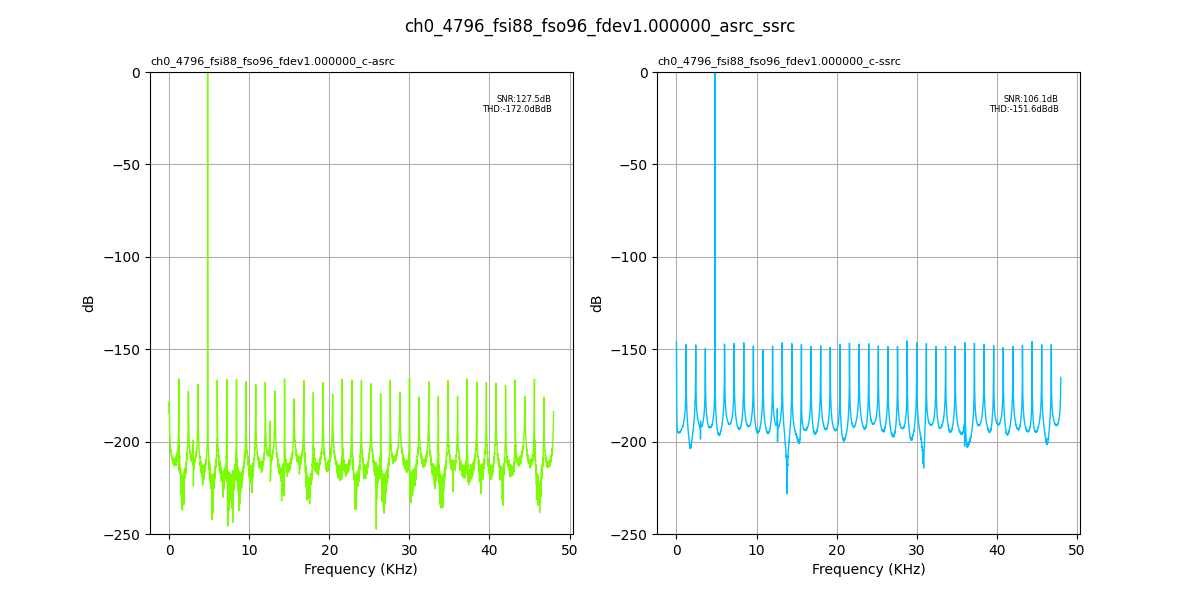
Fig. 131 Input Fs: 88,200Hz, Output Fs: 96,000Hz, Fs error: 1.000000, Results for: asrc, ssrc#
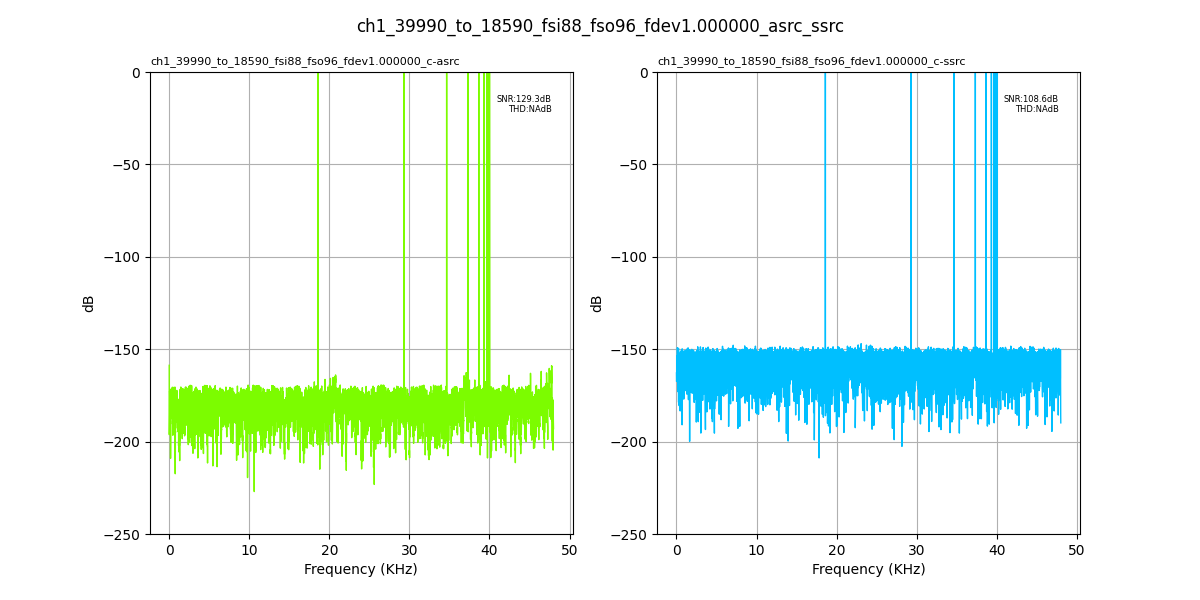
Fig. 132 Input Fs: 88,200Hz, Output Fs: 96,000Hz, Fs error: 1.000000, Results for: asrc, ssrc#
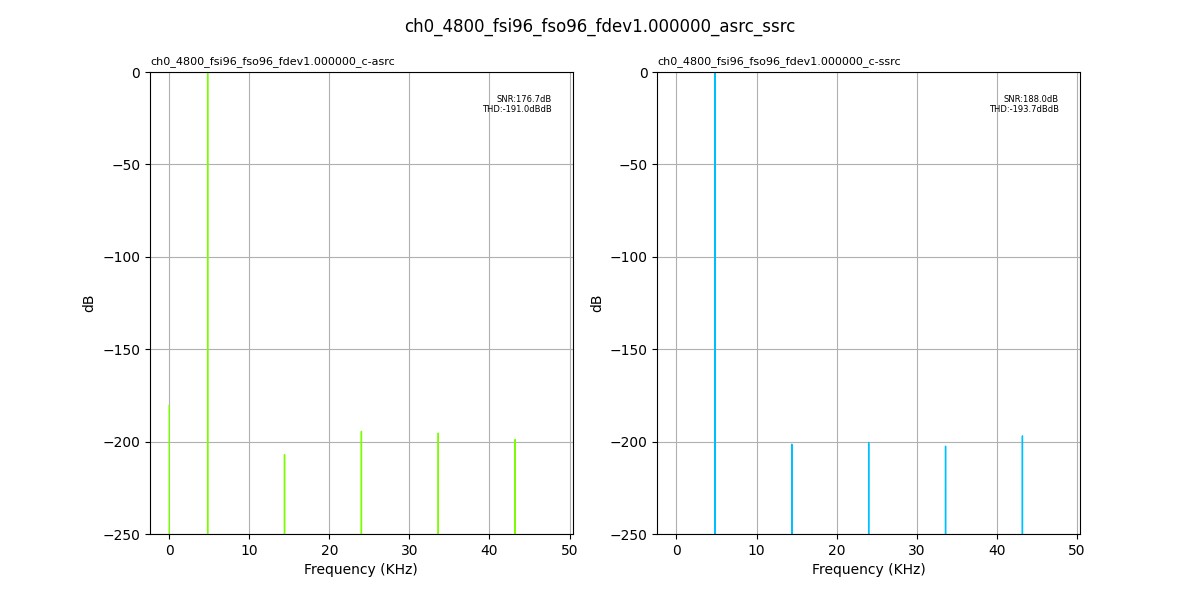
Fig. 133 Input Fs: 96,000Hz, Output Fs: 96,000Hz, Fs error: 1.000000, Results for: asrc, ssrc#
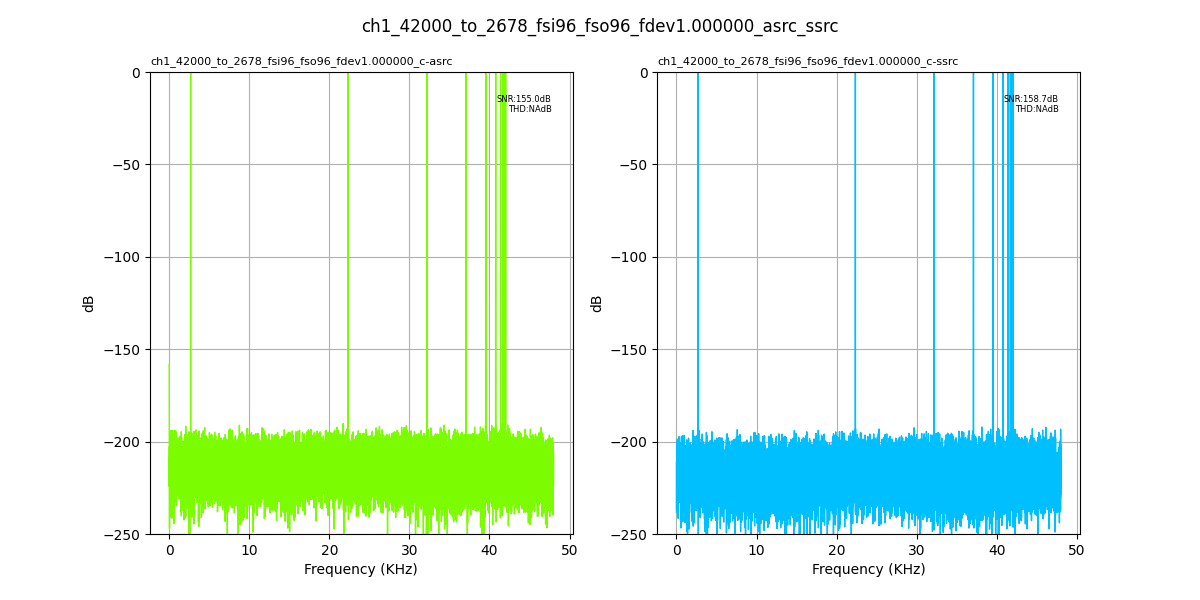
Fig. 134 Input Fs: 96,000Hz, Output Fs: 96,000Hz, Fs error: 1.000000, Results for: asrc, ssrc#
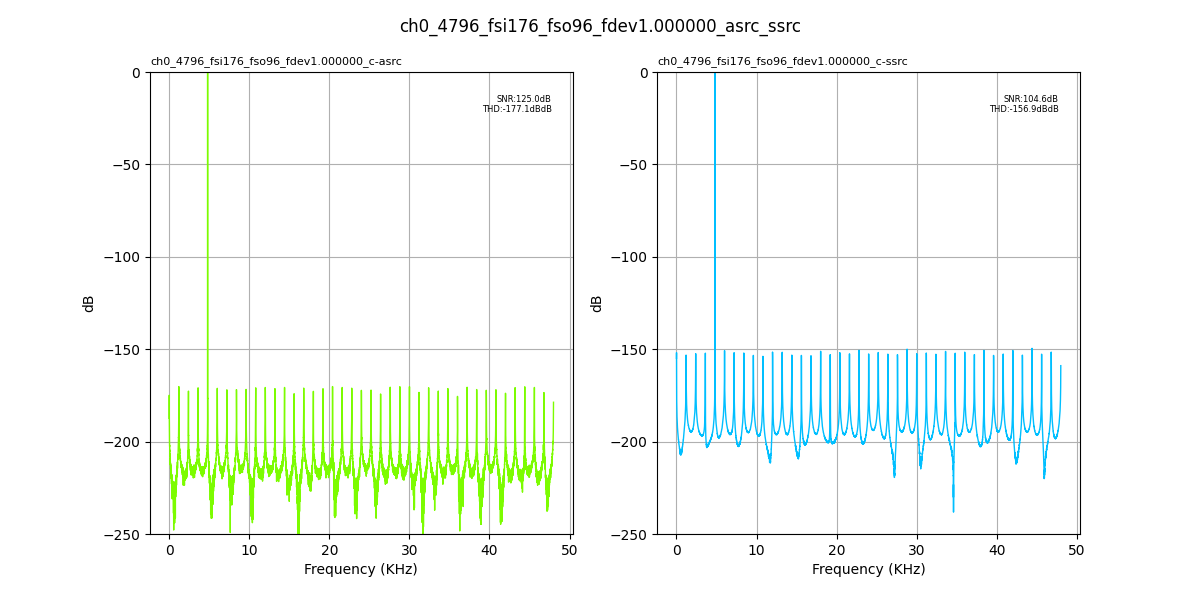
Fig. 135 Input Fs: 176,400Hz, Output Fs: 96,000Hz, Fs error: 1.000000, Results for: asrc, ssrc#
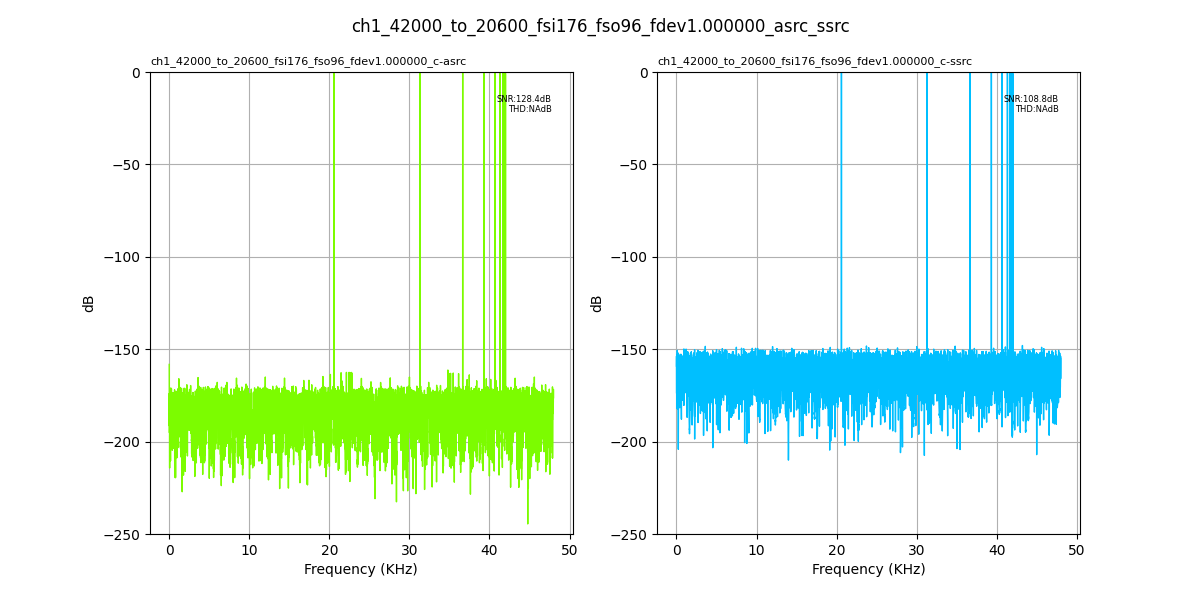
Fig. 136 Input Fs: 176,400Hz, Output Fs: 96,000Hz, Fs error: 1.000000, Results for: asrc, ssrc#
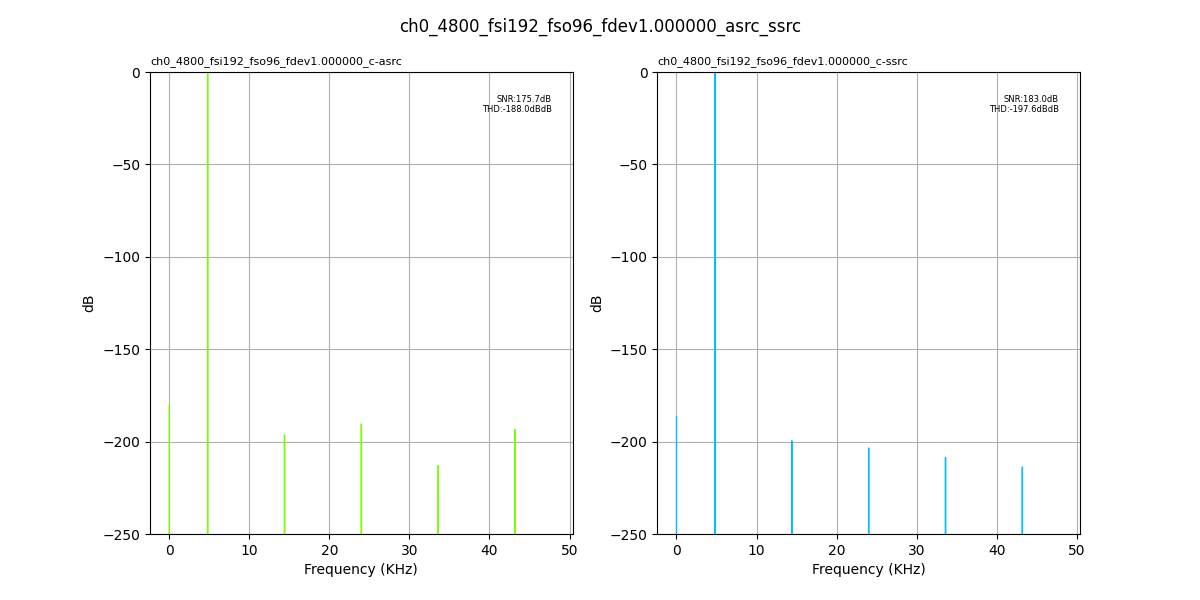
Fig. 137 Input Fs: 192,000Hz, Output Fs: 96,000Hz, Fs error: 1.000000, Results for: asrc, ssrc#
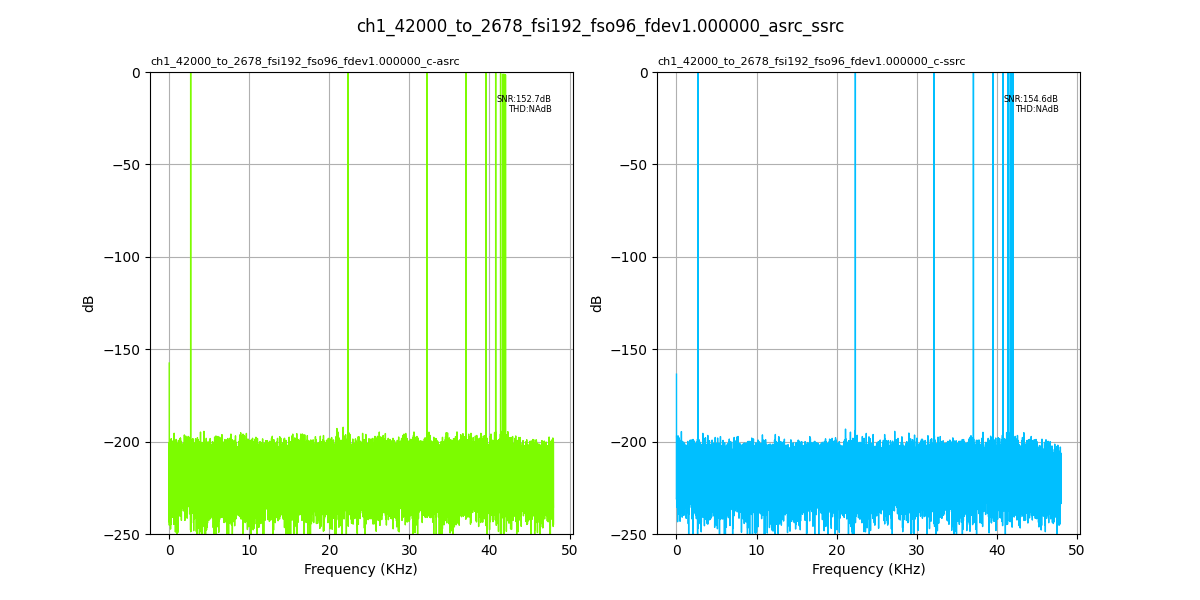
Fig. 138 Input Fs: 192,000Hz, Output Fs: 96,000Hz, Fs error: 1.000000, Results for: asrc, ssrc#
Output Fs : 176,400Hz#
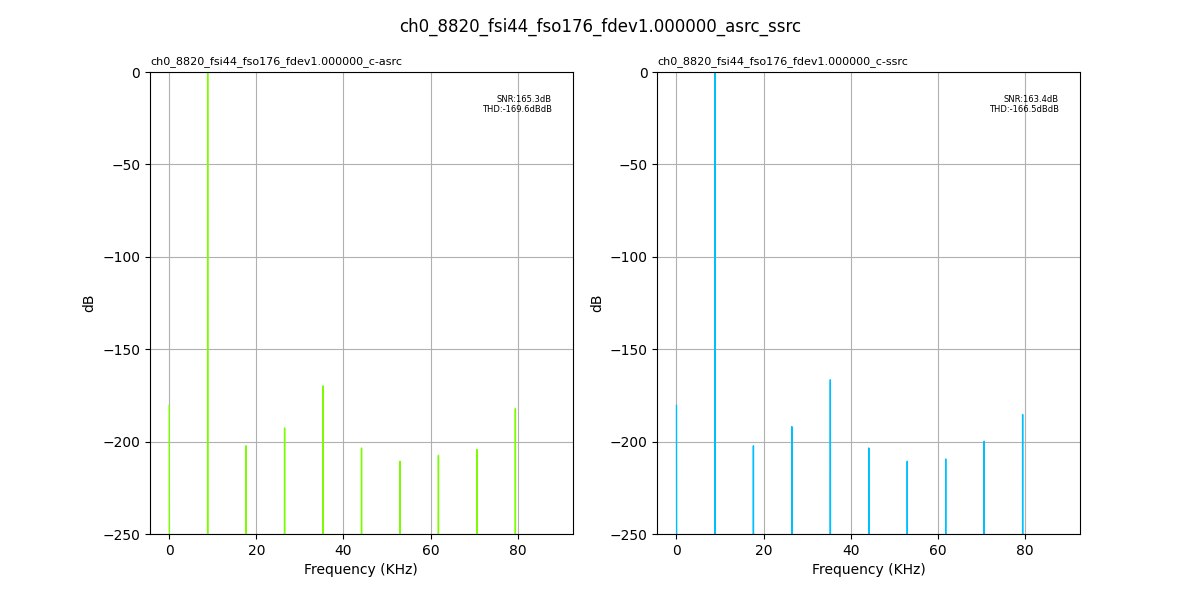
Fig. 139 Input Fs: 44,100Hz, Output Fs: 176,400Hz, Fs error: 1.000000, Results for: asrc, ssrc#
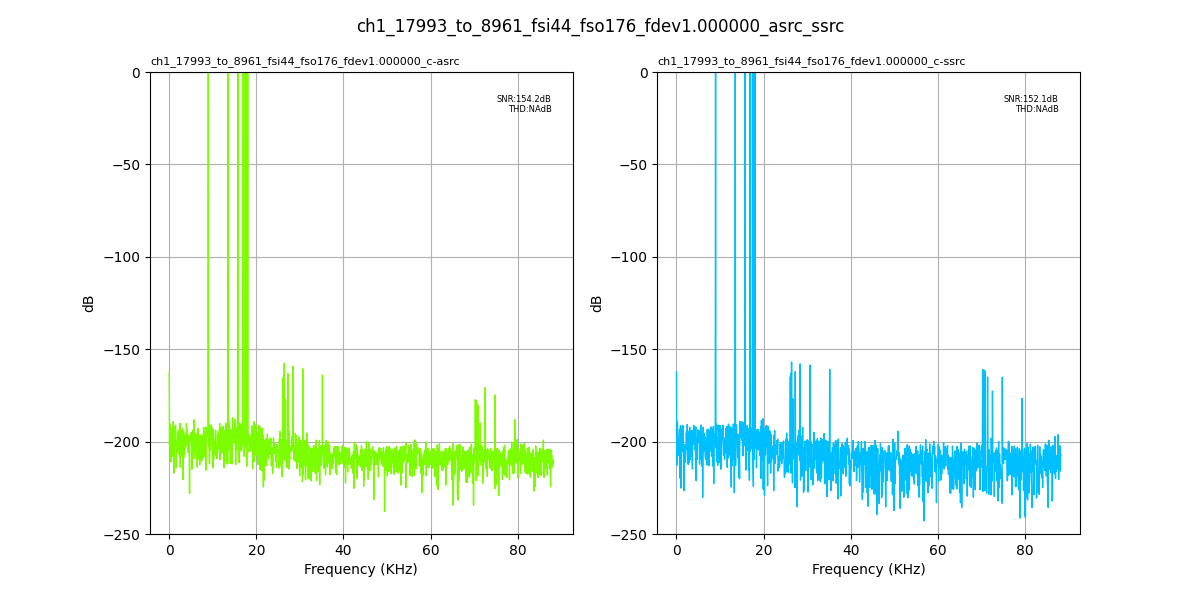
Fig. 140 Input Fs: 44,100Hz, Output Fs: 176,400Hz, Fs error: 1.000000, Results for: asrc, ssrc#
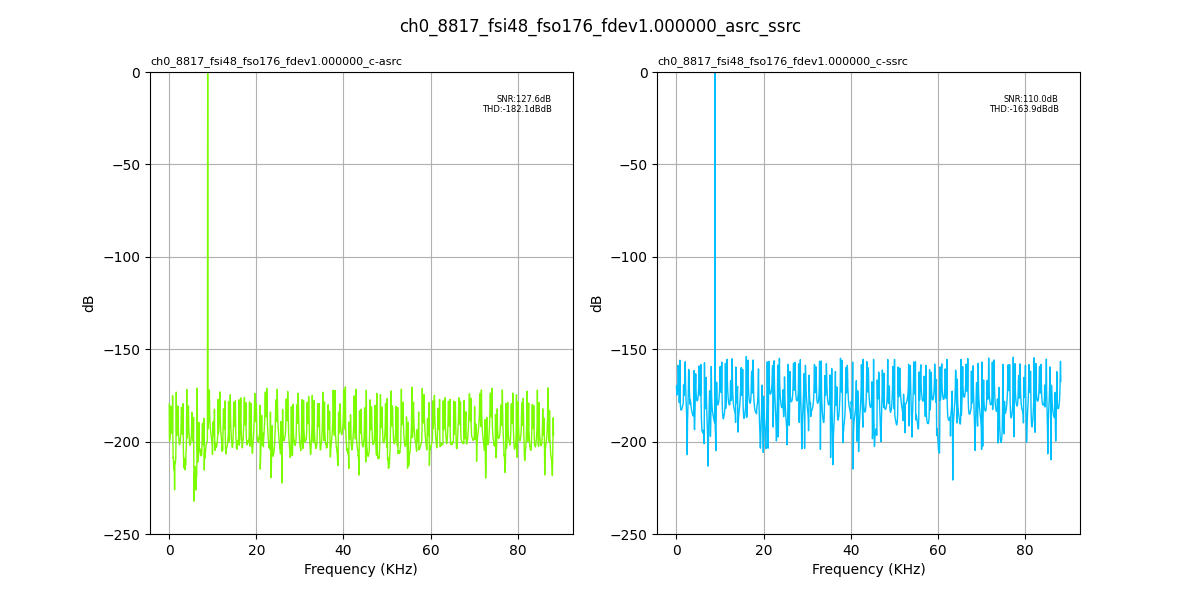
Fig. 141 Input Fs: 48,000Hz, Output Fs: 176,400Hz, Fs error: 1.000000, Results for: asrc, ssrc#
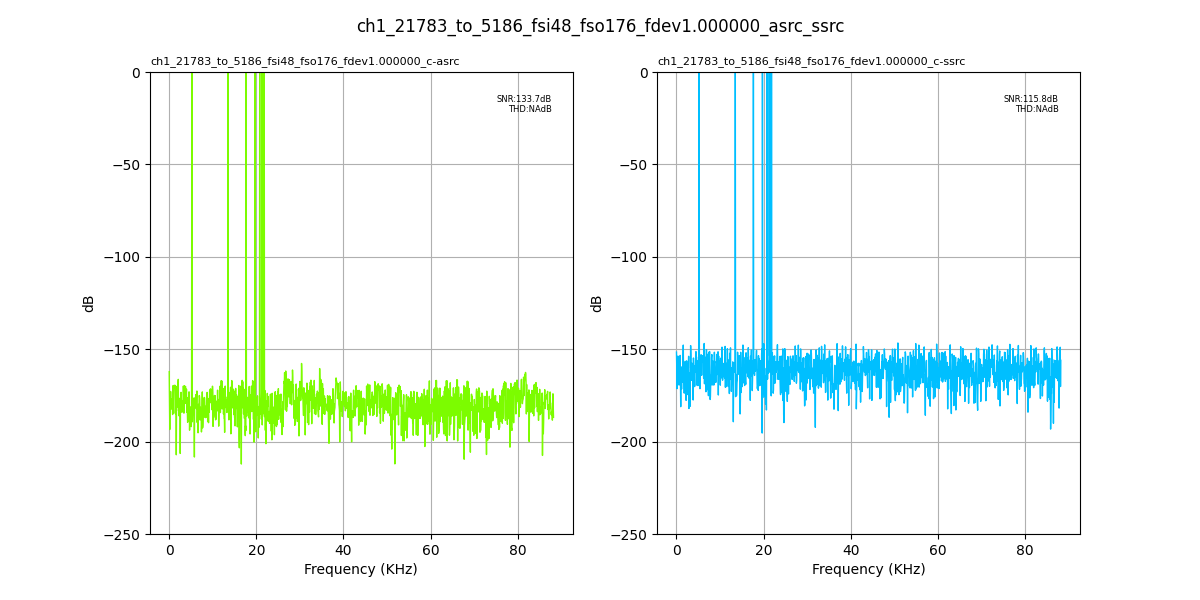
Fig. 142 Input Fs: 48,000Hz, Output Fs: 176,400Hz, Fs error: 1.000000, Results for: asrc, ssrc#
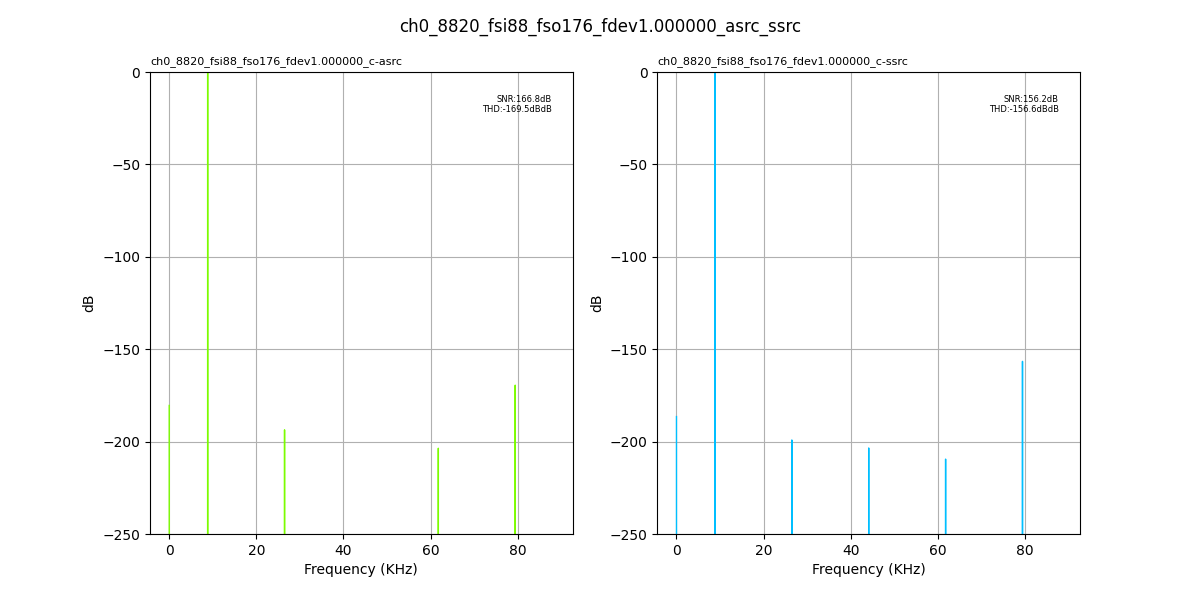
Fig. 143 Input Fs: 88,200Hz, Output Fs: 176,400Hz, Fs error: 1.000000, Results for: asrc, ssrc#
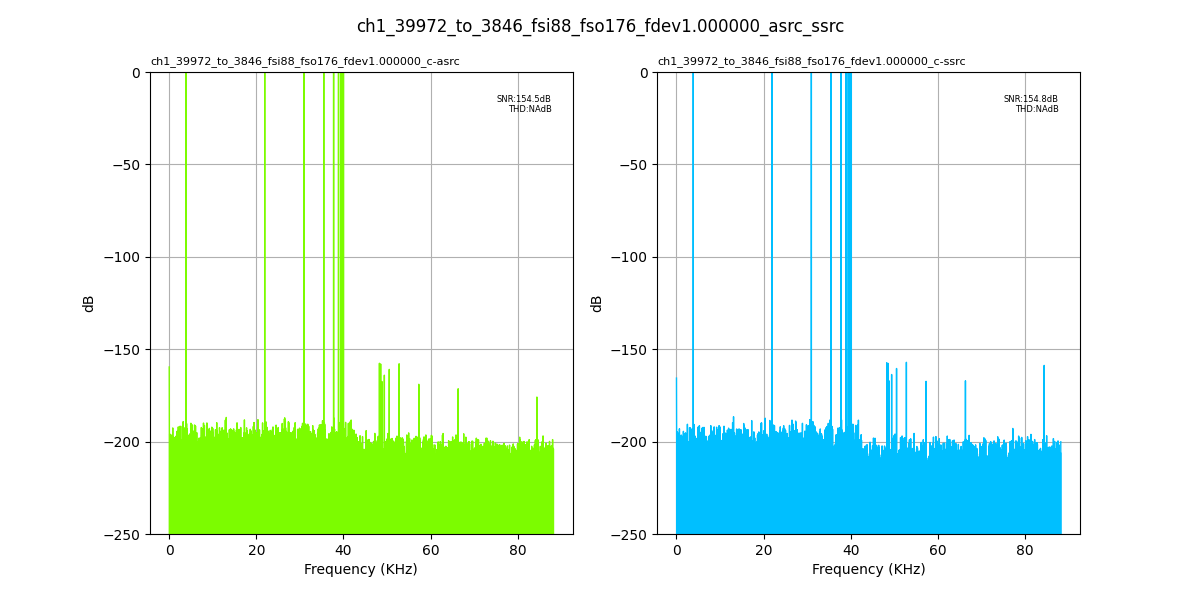
Fig. 144 Input Fs: 88,200Hz, Output Fs: 176,400Hz, Fs error: 1.000000, Results for: asrc, ssrc#
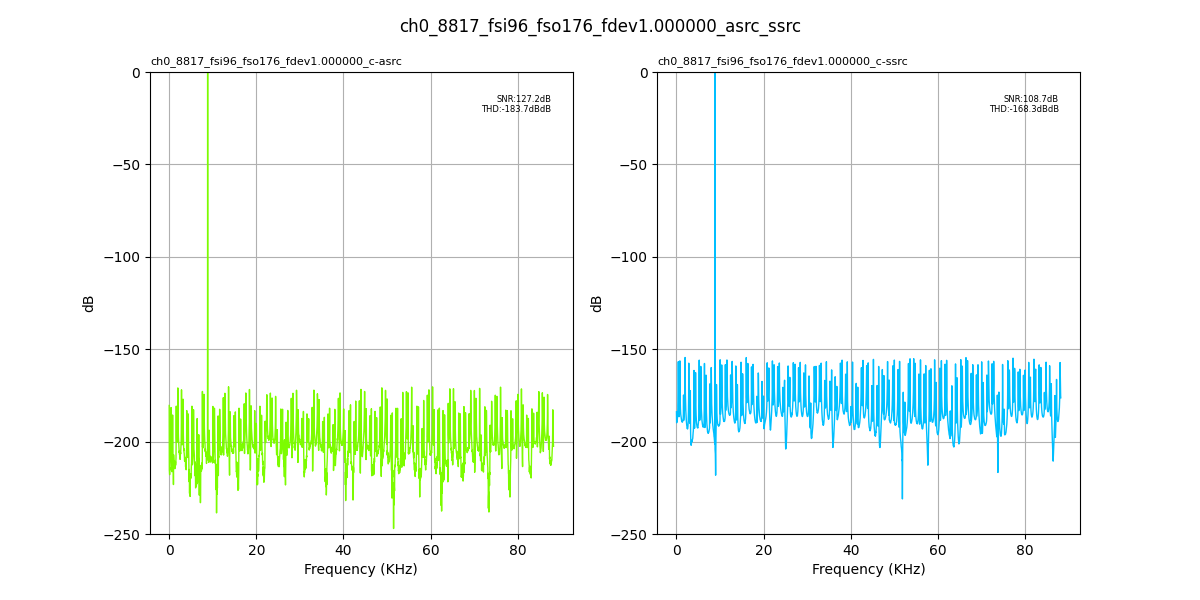
Fig. 145 Input Fs: 96,000Hz, Output Fs: 176,400Hz, Fs error: 1.000000, Results for: asrc, ssrc#
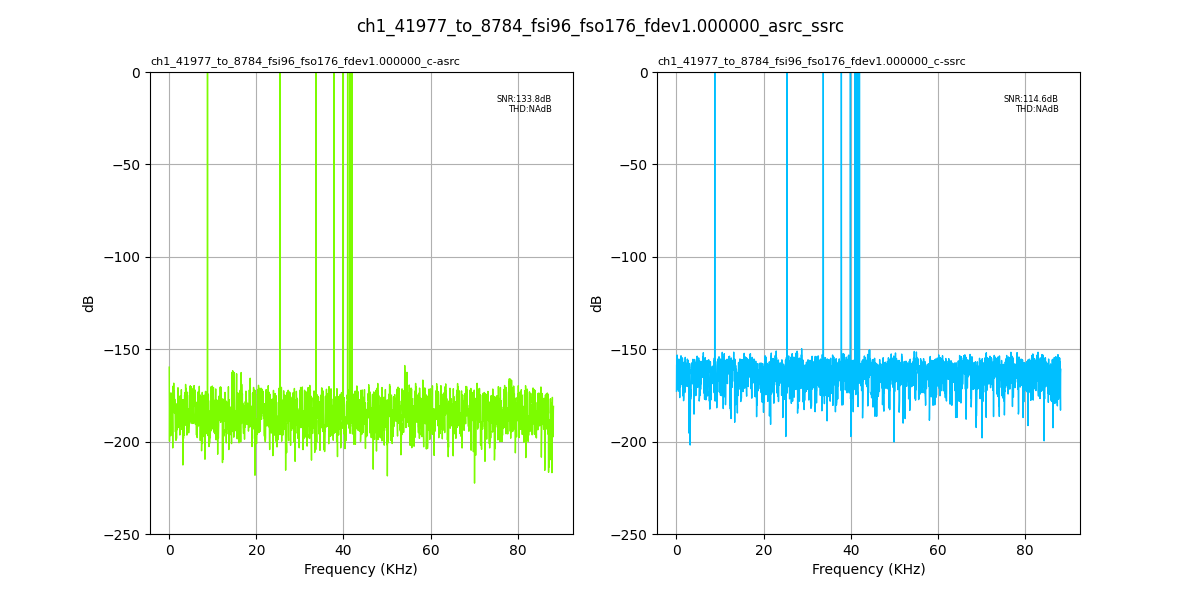
Fig. 146 Input Fs: 96,000Hz, Output Fs: 176,400Hz, Fs error: 1.000000, Results for: asrc, ssrc#
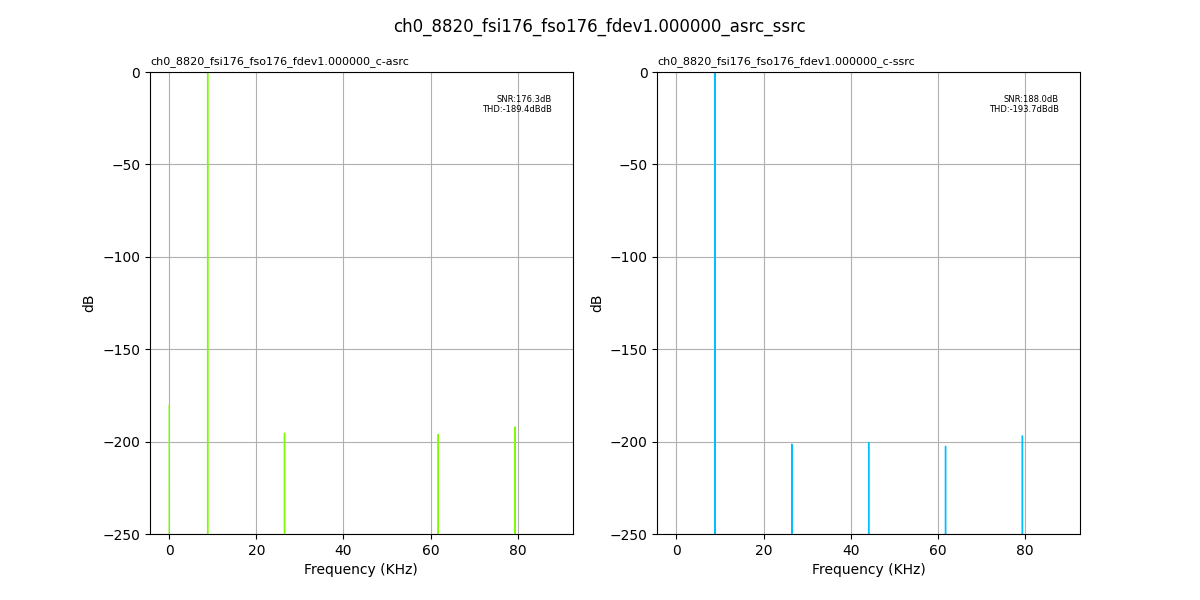
Fig. 147 Input Fs: 176,400Hz, Output Fs: 176,400Hz, Fs error: 1.000000, Results for: asrc, ssrc#
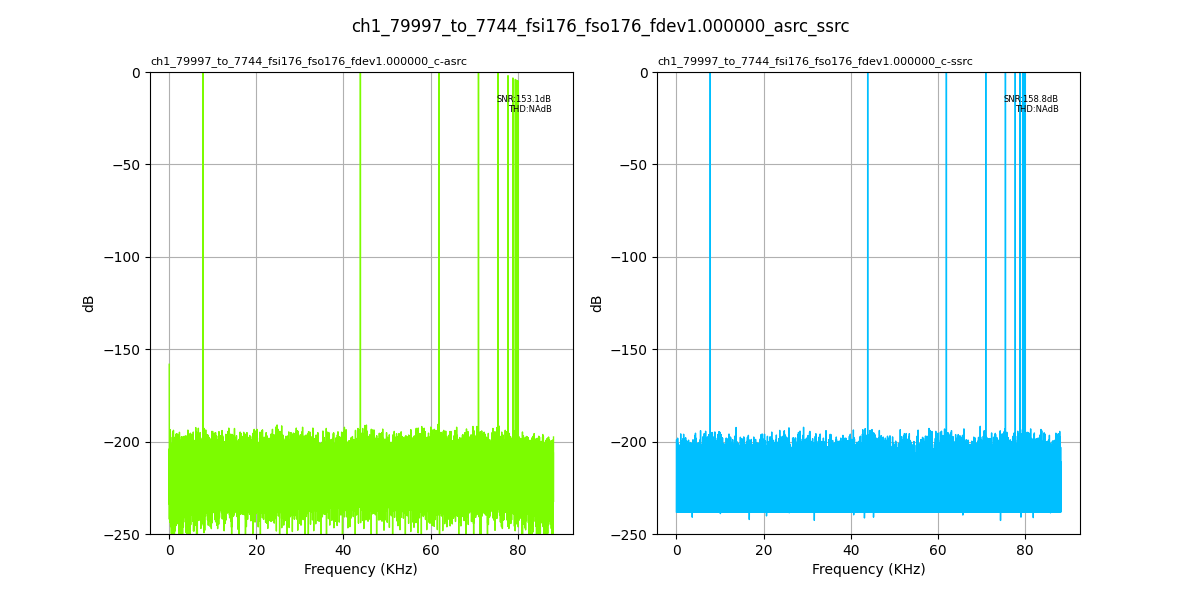
Fig. 148 Input Fs: 176,400Hz, Output Fs: 176,400Hz, Fs error: 1.000000, Results for: asrc, ssrc#
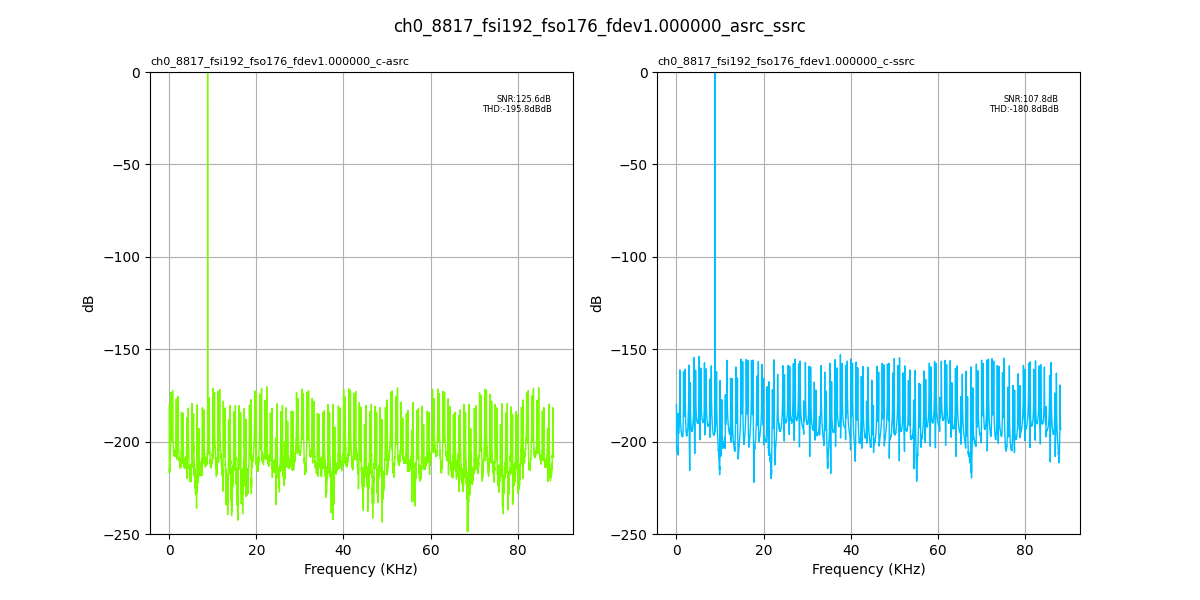
Fig. 149 Input Fs: 192,000Hz, Output Fs: 176,400Hz, Fs error: 1.000000, Results for: asrc, ssrc#
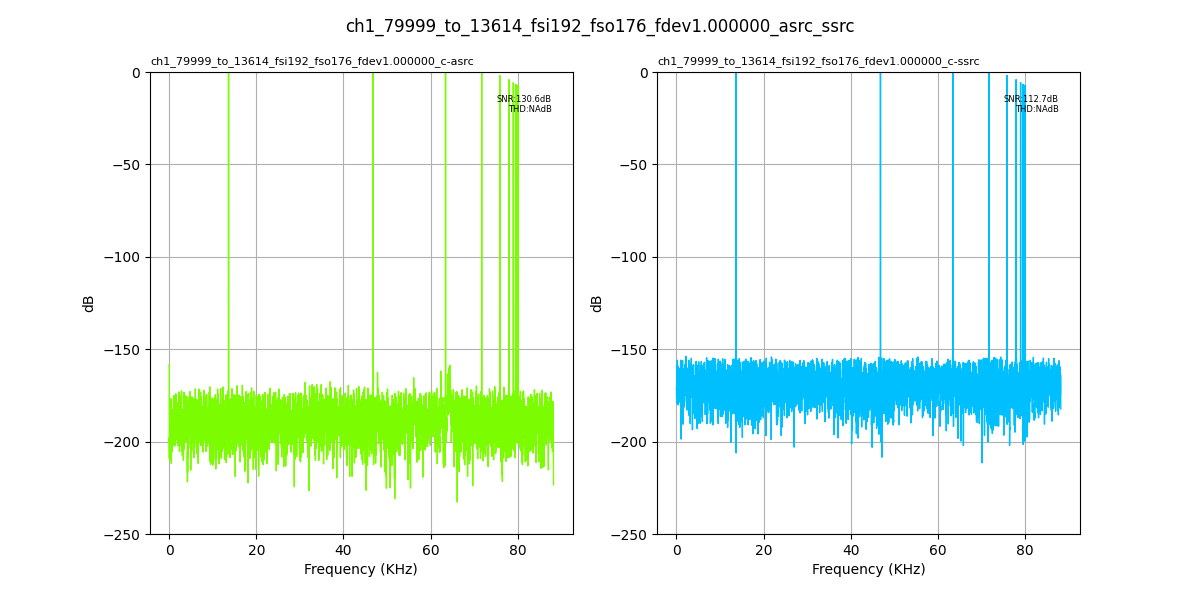
Fig. 150 Input Fs: 192,000Hz, Output Fs: 176,400Hz, Fs error: 1.000000, Results for: asrc, ssrc#
Output Fs : 192,000Hz#
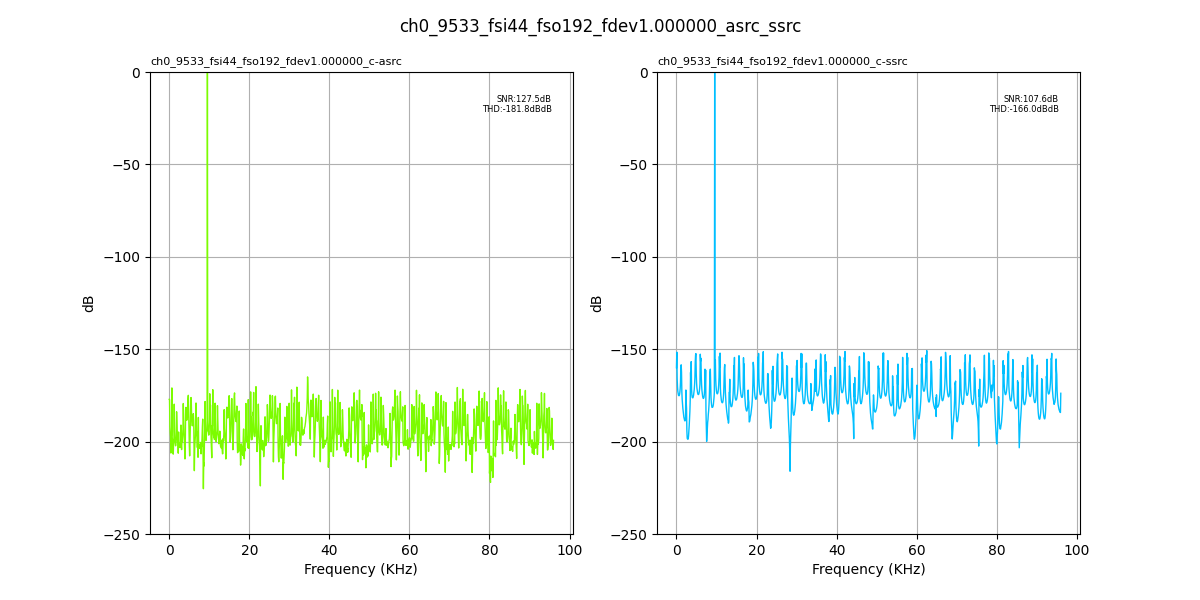
Fig. 151 Input Fs: 44,100Hz, Output Fs: 192,000Hz, Fs error: 1.000000, Results for: asrc, ssrc#
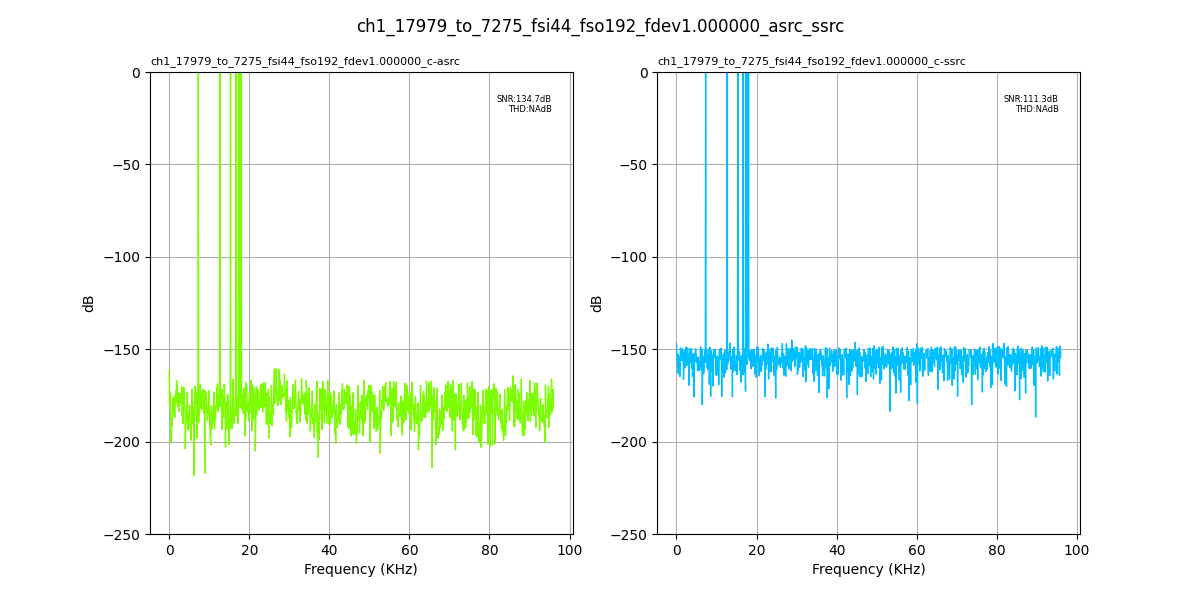
Fig. 152 Input Fs: 44,100Hz, Output Fs: 192,000Hz, Fs error: 1.000000, Results for: asrc, ssrc#
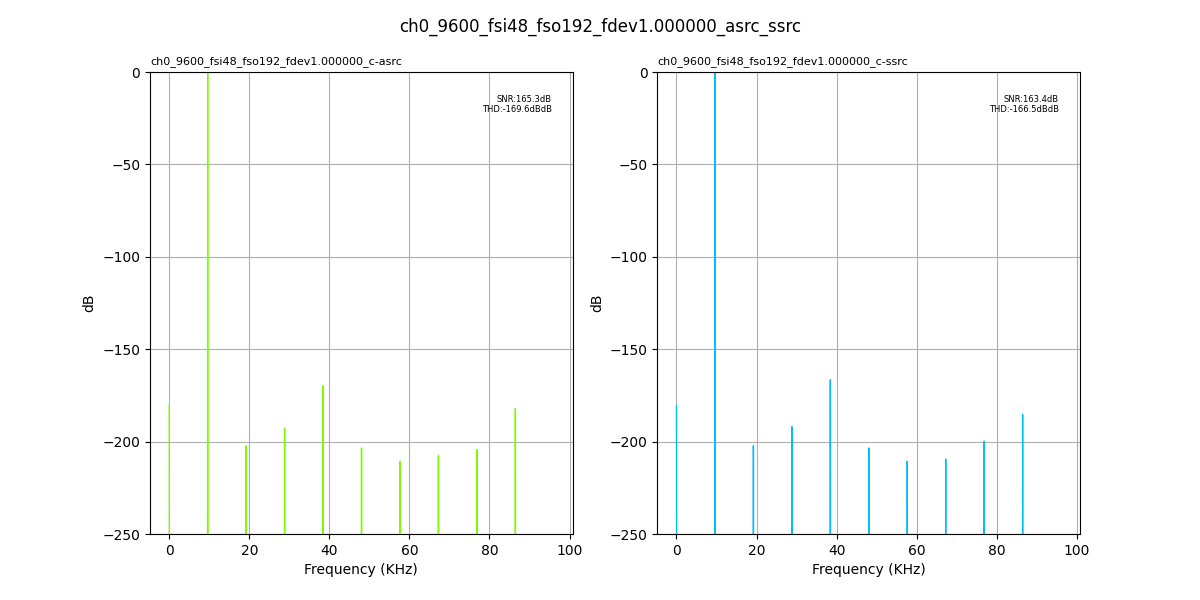
Fig. 153 Input Fs: 48,000Hz, Output Fs: 192,000Hz, Fs error: 1.000000, Results for: asrc, ssrc#
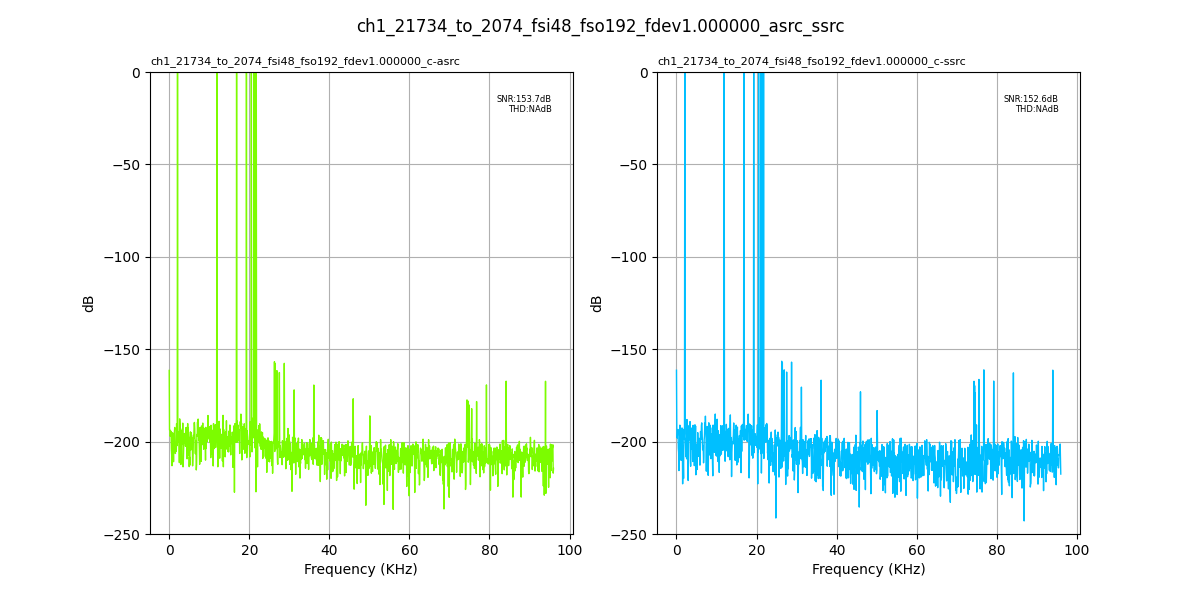
Fig. 154 Input Fs: 48,000Hz, Output Fs: 192,000Hz, Fs error: 1.000000, Results for: asrc, ssrc#
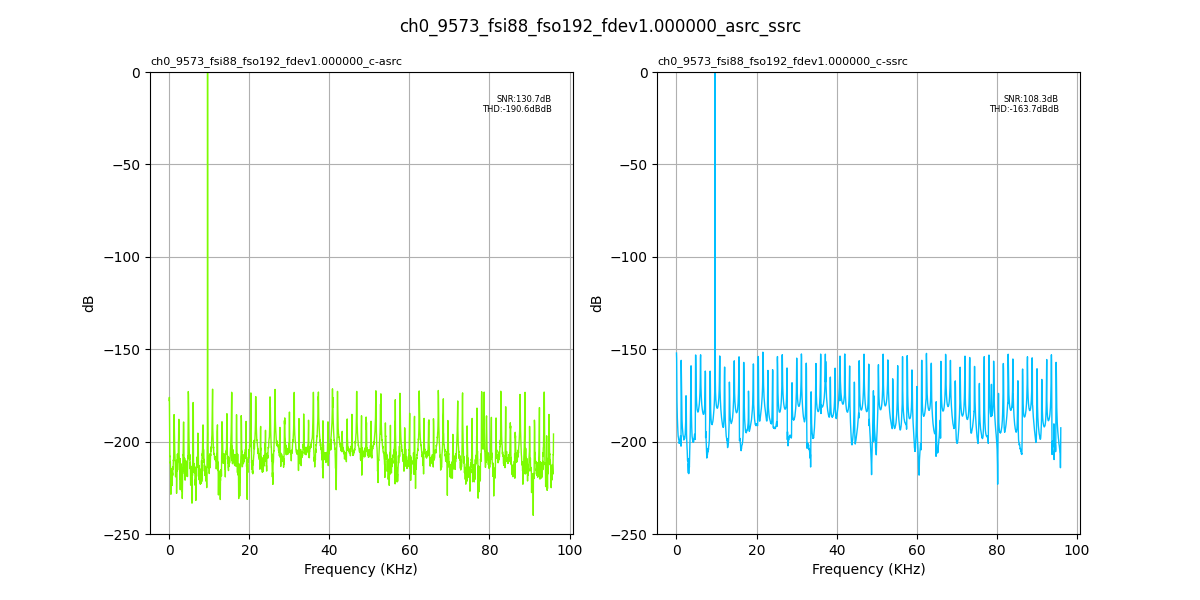
Fig. 155 Input Fs: 88,200Hz, Output Fs: 192,000Hz, Fs error: 1.000000, Results for: asrc, ssrc#
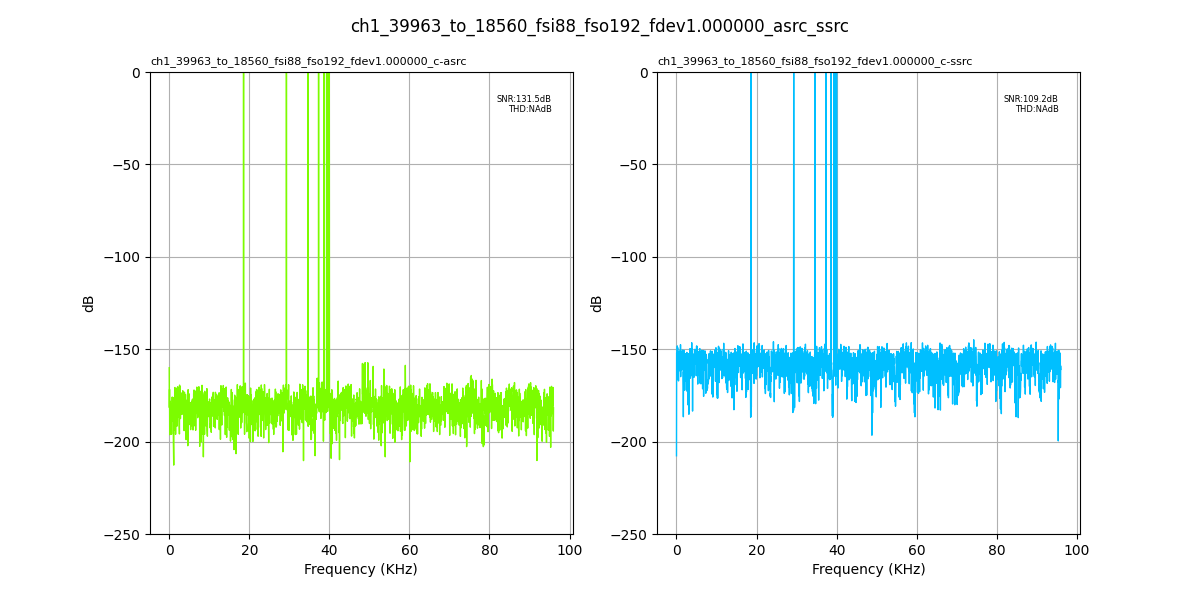
Fig. 156 Input Fs: 88,200Hz, Output Fs: 192,000Hz, Fs error: 1.000000, Results for: asrc, ssrc#
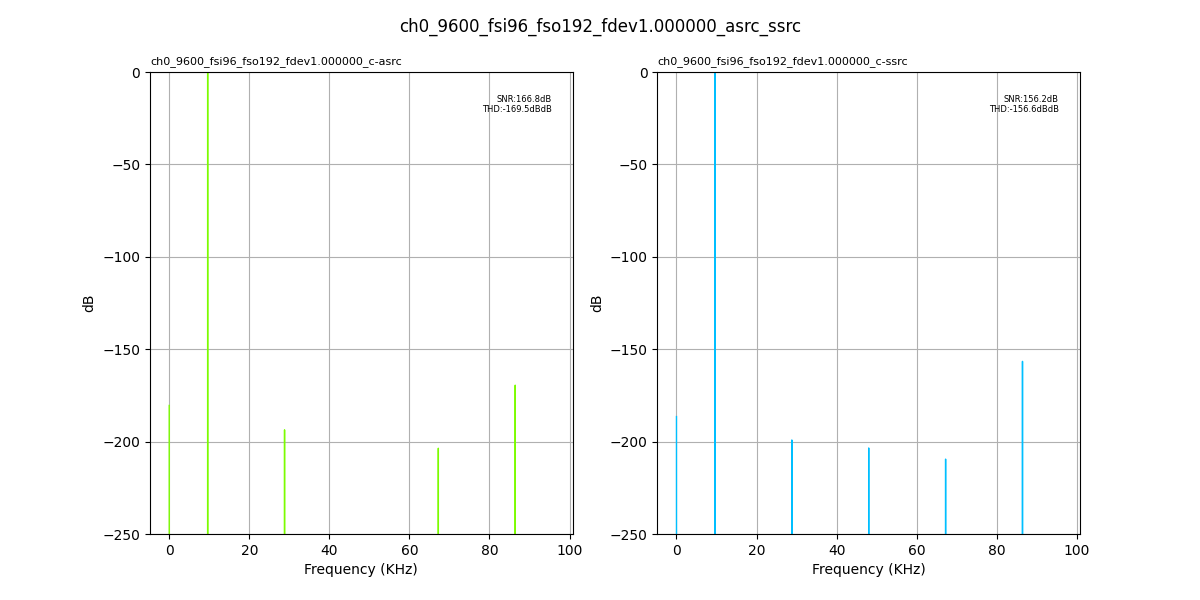
Fig. 157 Input Fs: 96,000Hz, Output Fs: 192,000Hz, Fs error: 1.000000, Results for: asrc, ssrc#
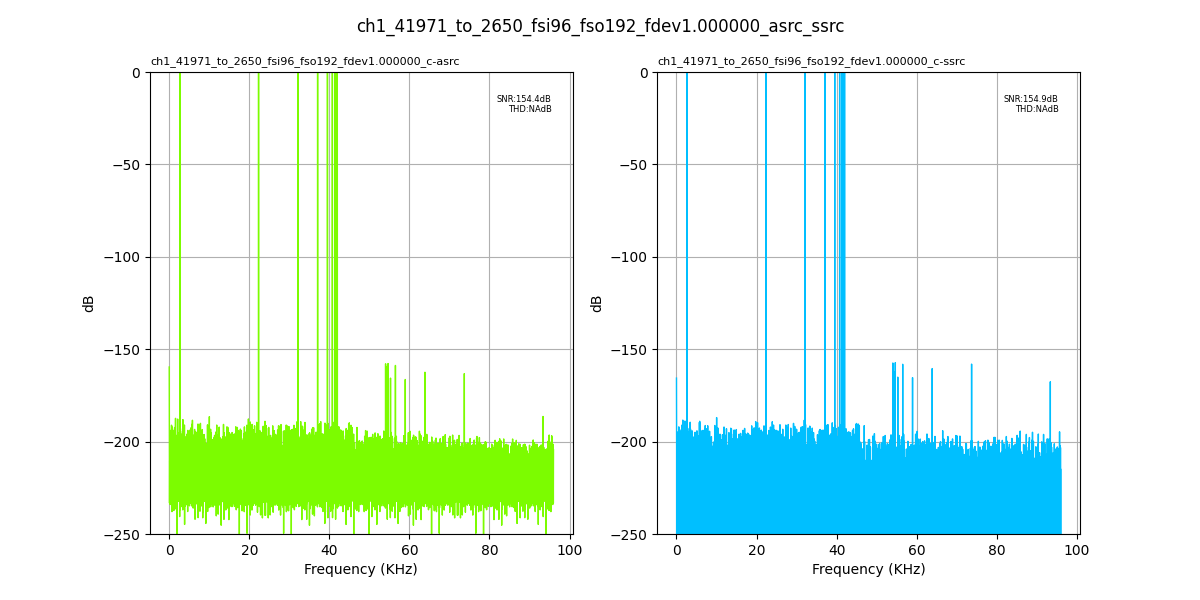
Fig. 158 Input Fs: 96,000Hz, Output Fs: 192,000Hz, Fs error: 1.000000, Results for: asrc, ssrc#
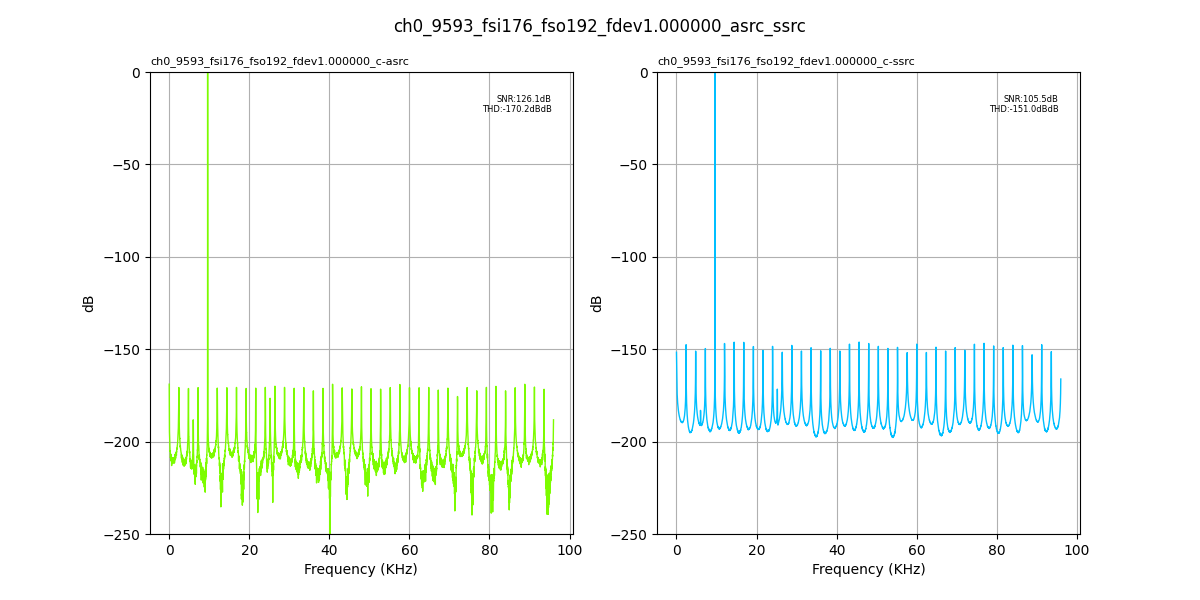
Fig. 159 Input Fs: 176,400Hz, Output Fs: 192,000Hz, Fs error: 1.000000, Results for: asrc, ssrc#
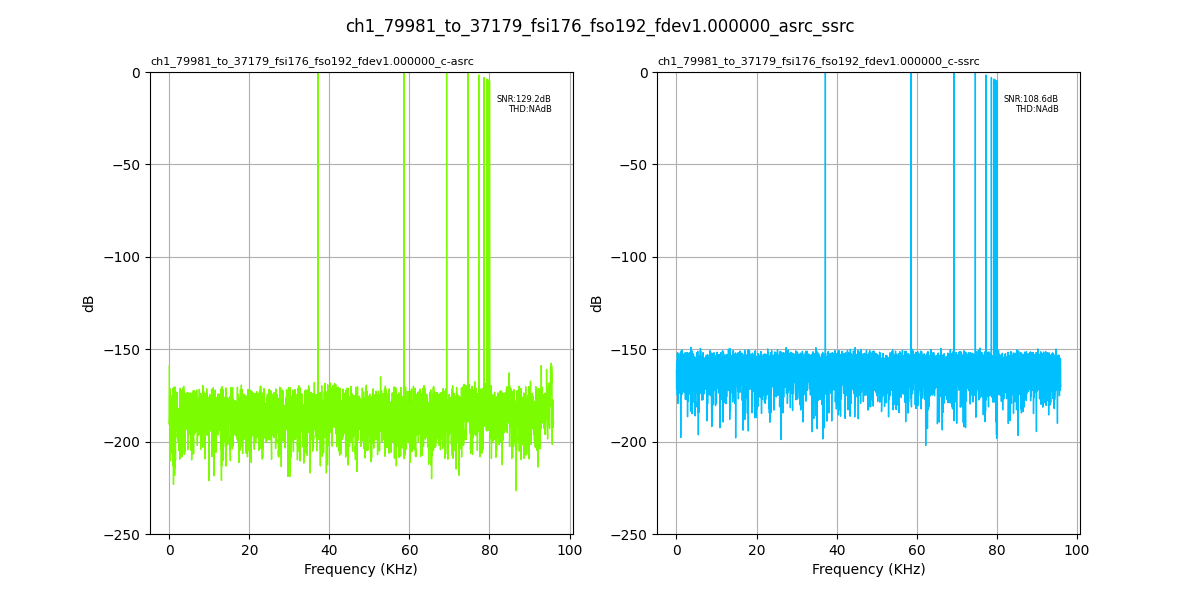
Fig. 160 Input Fs: 176,400Hz, Output Fs: 192,000Hz, Fs error: 1.000000, Results for: asrc, ssrc#
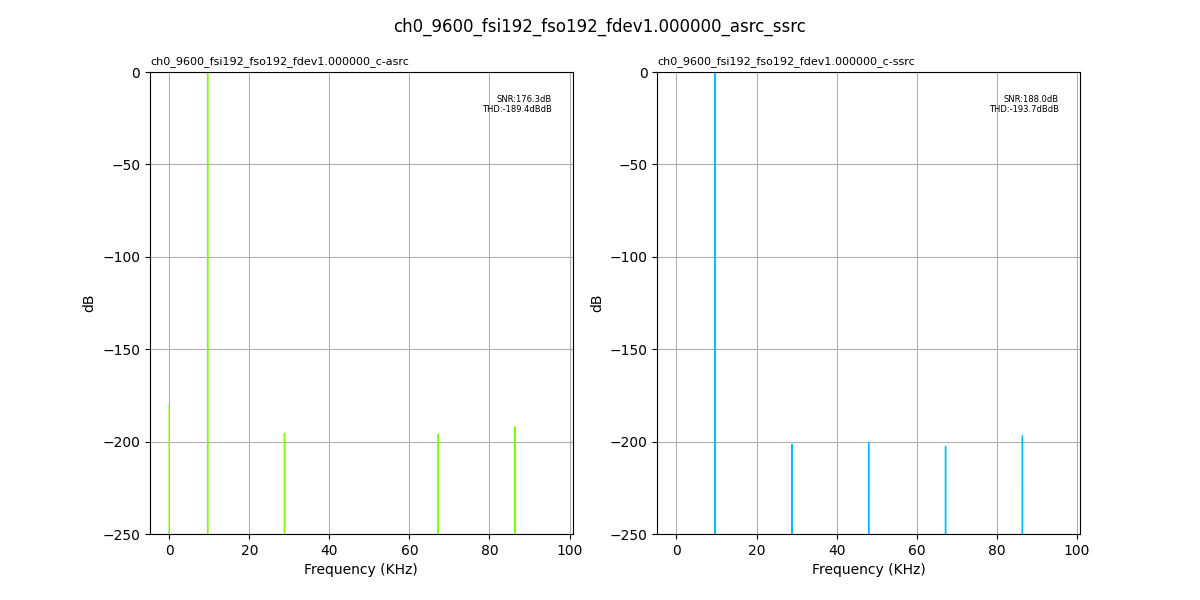
Fig. 161 Input Fs: 192,000Hz, Output Fs: 192,000Hz, Fs error: 1.000000, Results for: asrc, ssrc#
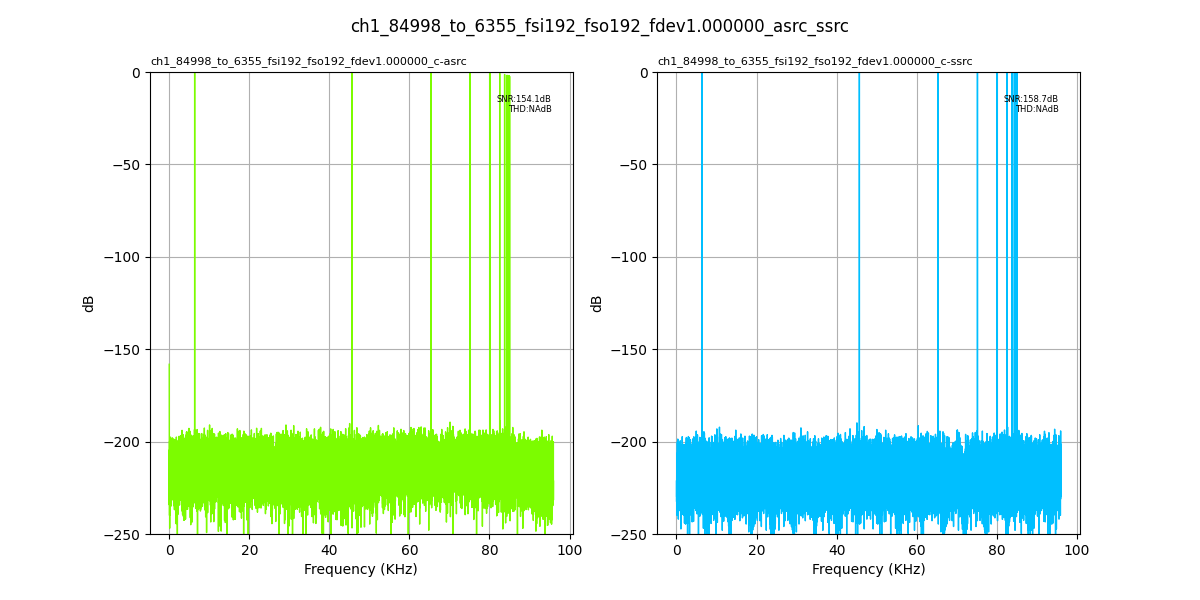
Fig. 162 Input Fs: 192,000Hz, Output Fs: 192,000Hz, Fs error: 1.000000, Results for: asrc, ssrc#
Frequency error: 1.000100Hz#
Output Fs : 16,000Hz#
No SRC available for this scenario.
Output Fs : 32,000Hz#
No SRC available for this scenario.
Output Fs : 44,100Hz#
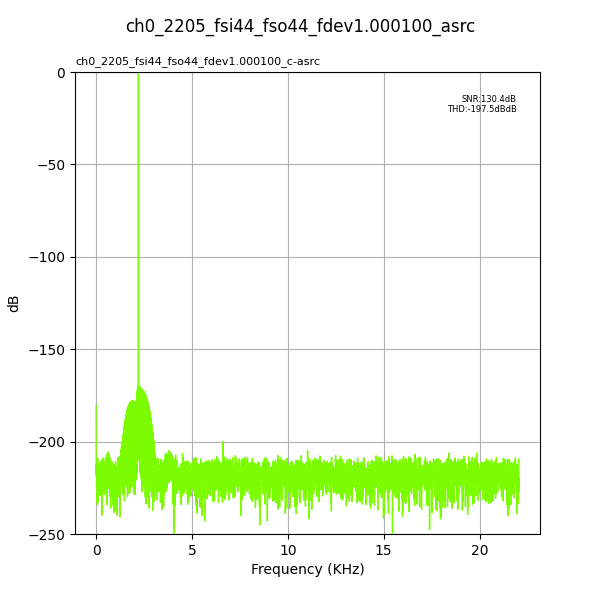
Fig. 163 Input Fs: 44,100Hz, Output Fs: 44,100Hz, Fs error: 1.000100, Results for: asrc#
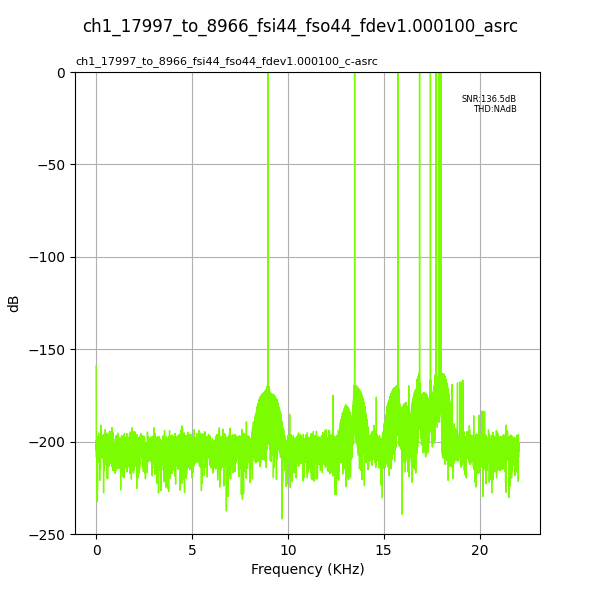
Fig. 164 Input Fs: 44,100Hz, Output Fs: 44,100Hz, Fs error: 1.000100, Results for: asrc#
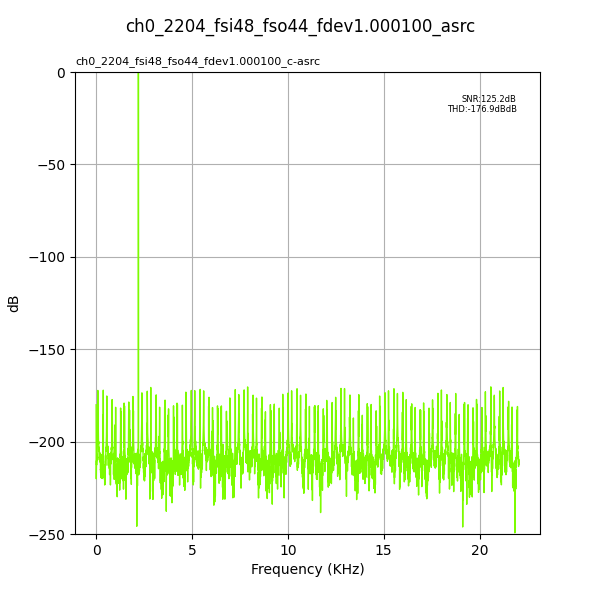
Fig. 165 Input Fs: 48,000Hz, Output Fs: 44,100Hz, Fs error: 1.000100, Results for: asrc#
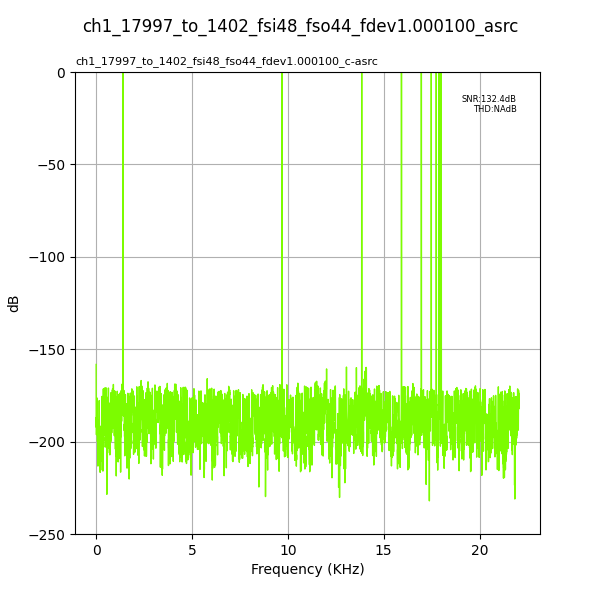
Fig. 166 Input Fs: 48,000Hz, Output Fs: 44,100Hz, Fs error: 1.000100, Results for: asrc#
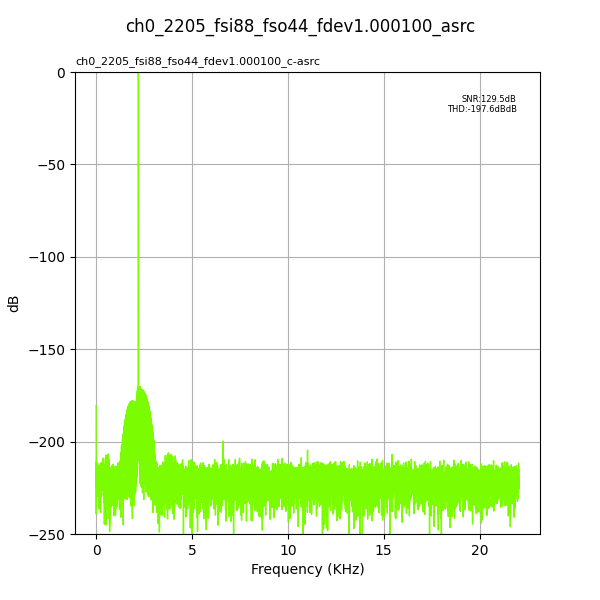
Fig. 167 Input Fs: 88,200Hz, Output Fs: 44,100Hz, Fs error: 1.000100, Results for: asrc#
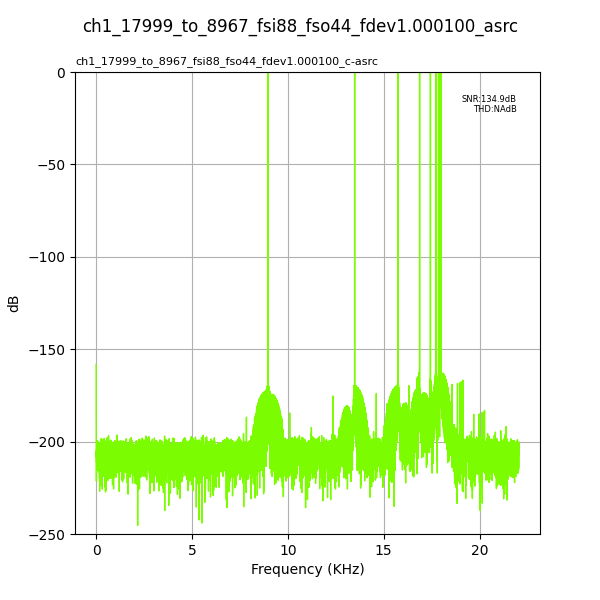
Fig. 168 Input Fs: 88,200Hz, Output Fs: 44,100Hz, Fs error: 1.000100, Results for: asrc#
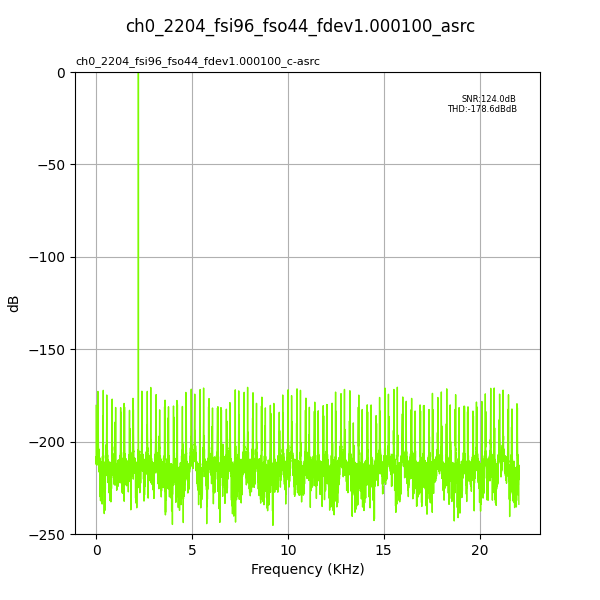
Fig. 169 Input Fs: 96,000Hz, Output Fs: 44,100Hz, Fs error: 1.000100, Results for: asrc#
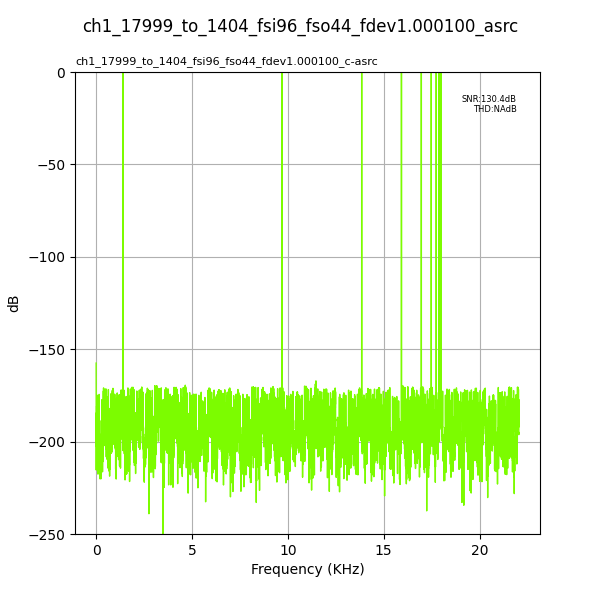
Fig. 170 Input Fs: 96,000Hz, Output Fs: 44,100Hz, Fs error: 1.000100, Results for: asrc#
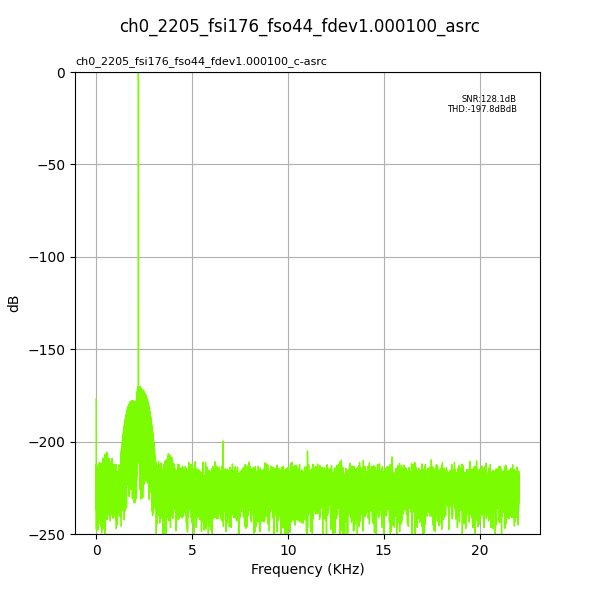
Fig. 171 Input Fs: 176,400Hz, Output Fs: 44,100Hz, Fs error: 1.000100, Results for: asrc#
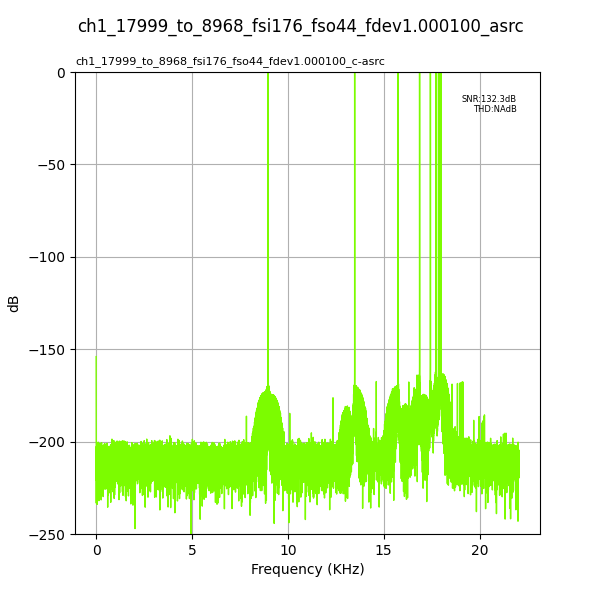
Fig. 172 Input Fs: 176,400Hz, Output Fs: 44,100Hz, Fs error: 1.000100, Results for: asrc#
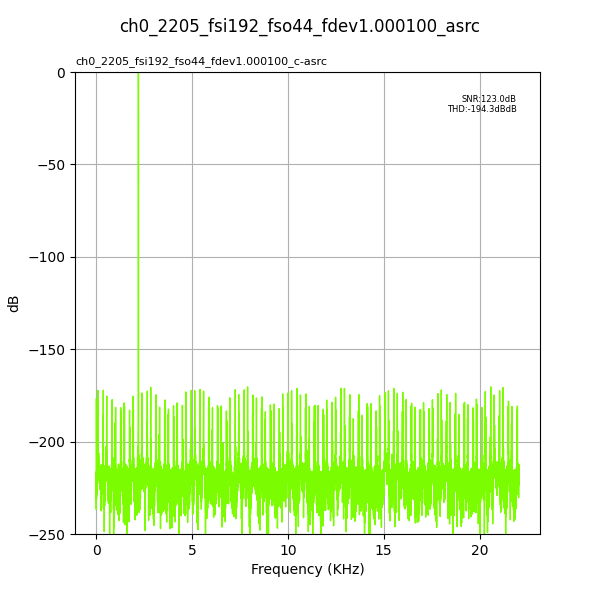
Fig. 173 Input Fs: 192,000Hz, Output Fs: 44,100Hz, Fs error: 1.000100, Results for: asrc#
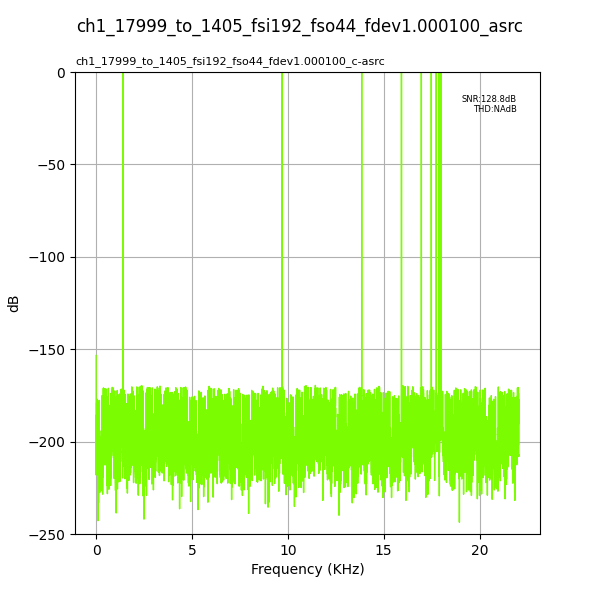
Fig. 174 Input Fs: 192,000Hz, Output Fs: 44,100Hz, Fs error: 1.000100, Results for: asrc#
Output Fs : 48,000Hz#
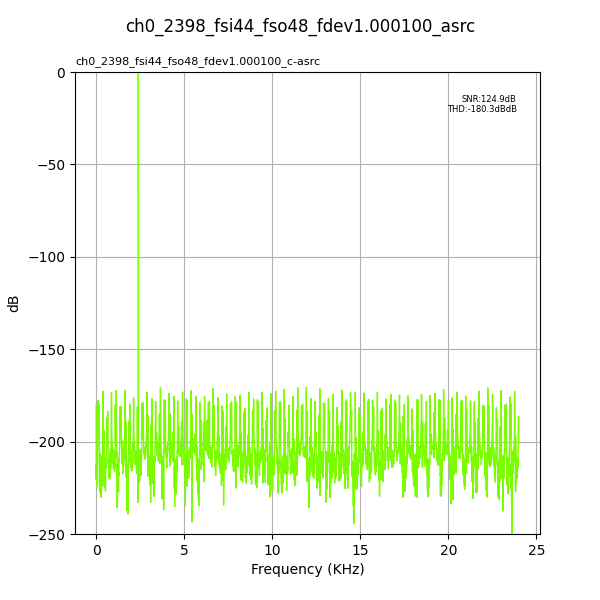
Fig. 175 Input Fs: 44,100Hz, Output Fs: 48,000Hz, Fs error: 1.000100, Results for: asrc#
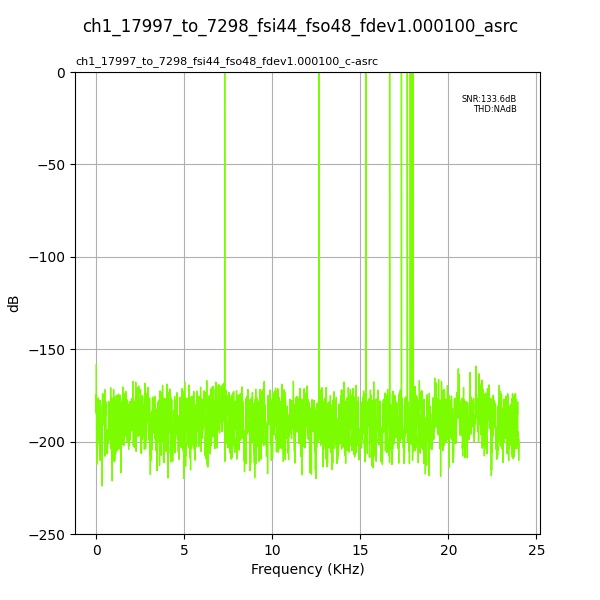
Fig. 176 Input Fs: 44,100Hz, Output Fs: 48,000Hz, Fs error: 1.000100, Results for: asrc#
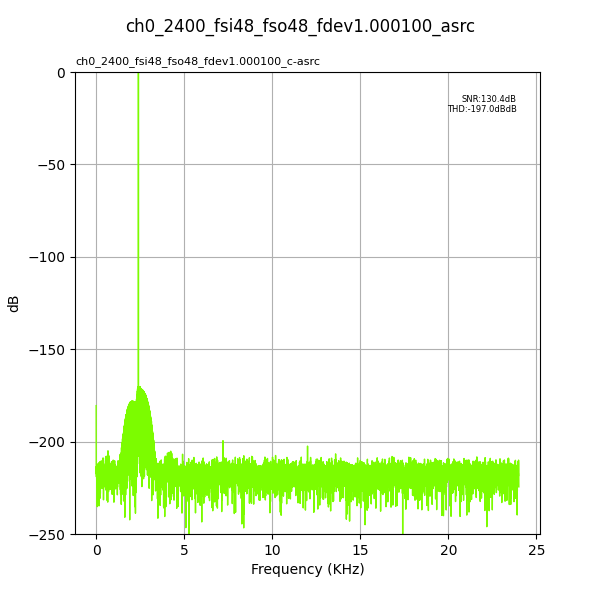
Fig. 177 Input Fs: 48,000Hz, Output Fs: 48,000Hz, Fs error: 1.000100, Results for: asrc#
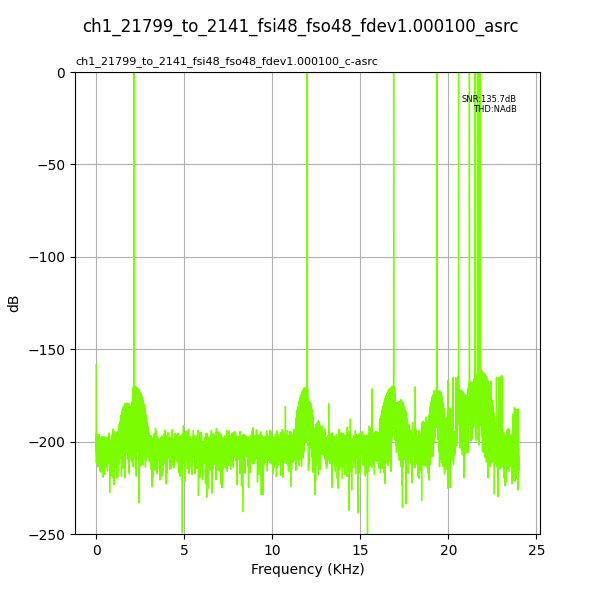
Fig. 178 Input Fs: 48,000Hz, Output Fs: 48,000Hz, Fs error: 1.000100, Results for: asrc#
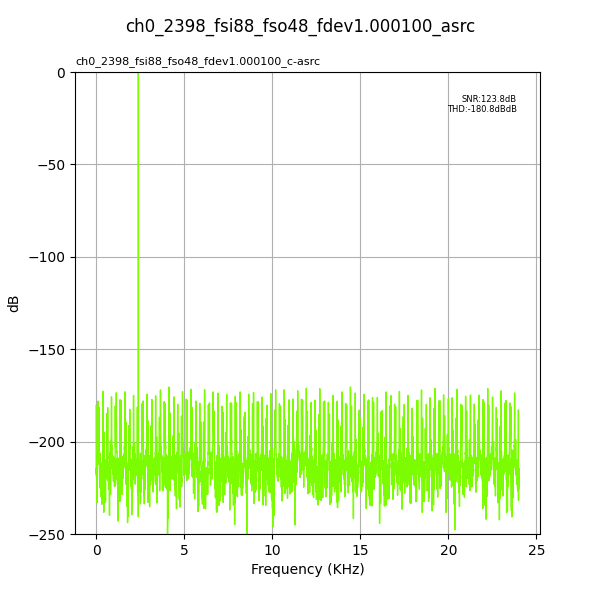
Fig. 179 Input Fs: 88,200Hz, Output Fs: 48,000Hz, Fs error: 1.000100, Results for: asrc#
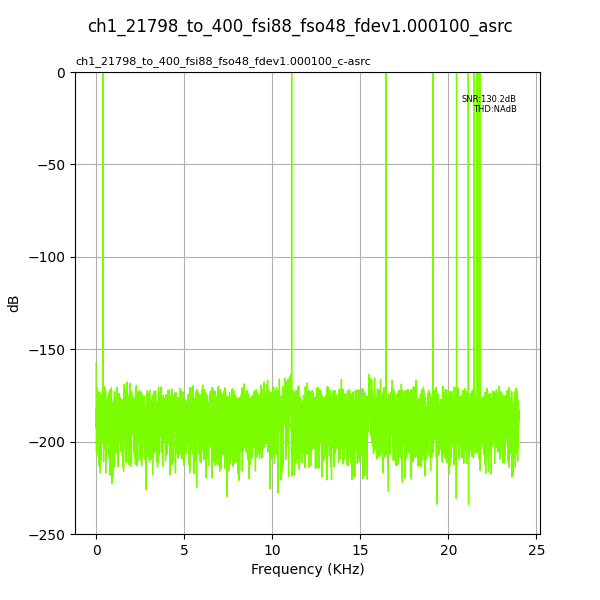
Fig. 180 Input Fs: 88,200Hz, Output Fs: 48,000Hz, Fs error: 1.000100, Results for: asrc#
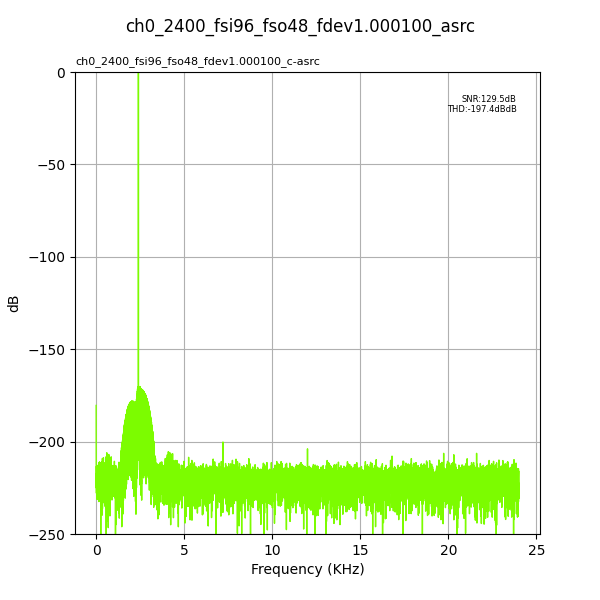
Fig. 181 Input Fs: 96,000Hz, Output Fs: 48,000Hz, Fs error: 1.000100, Results for: asrc#
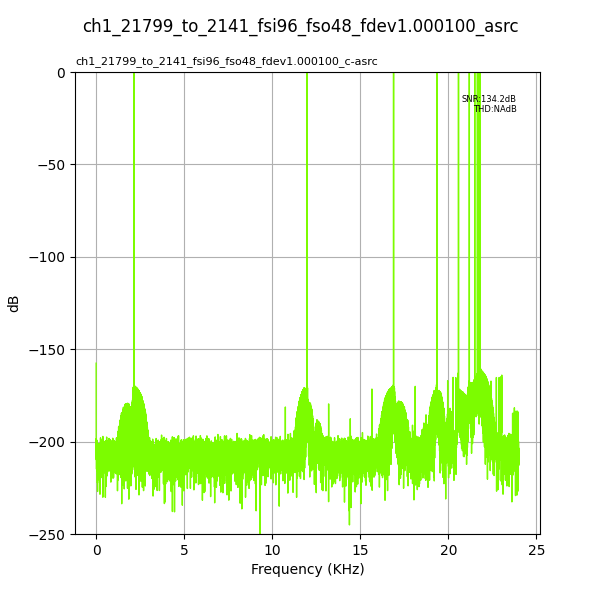
Fig. 182 Input Fs: 96,000Hz, Output Fs: 48,000Hz, Fs error: 1.000100, Results for: asrc#
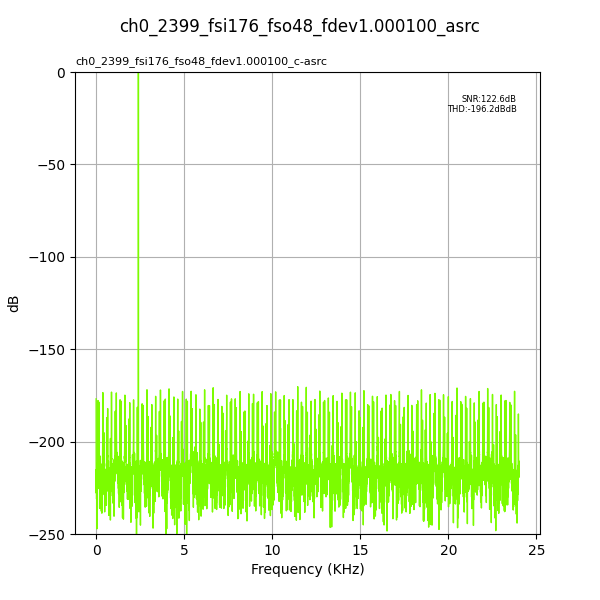
Fig. 183 Input Fs: 176,400Hz, Output Fs: 48,000Hz, Fs error: 1.000100, Results for: asrc#
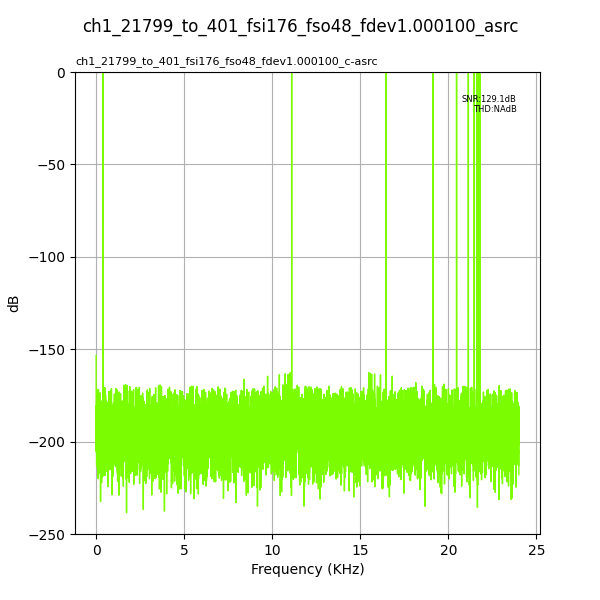
Fig. 184 Input Fs: 176,400Hz, Output Fs: 48,000Hz, Fs error: 1.000100, Results for: asrc#
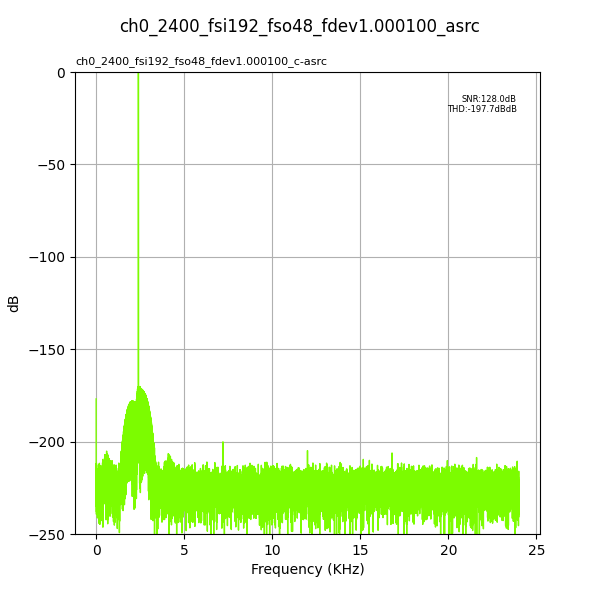
Fig. 185 Input Fs: 192,000Hz, Output Fs: 48,000Hz, Fs error: 1.000100, Results for: asrc#
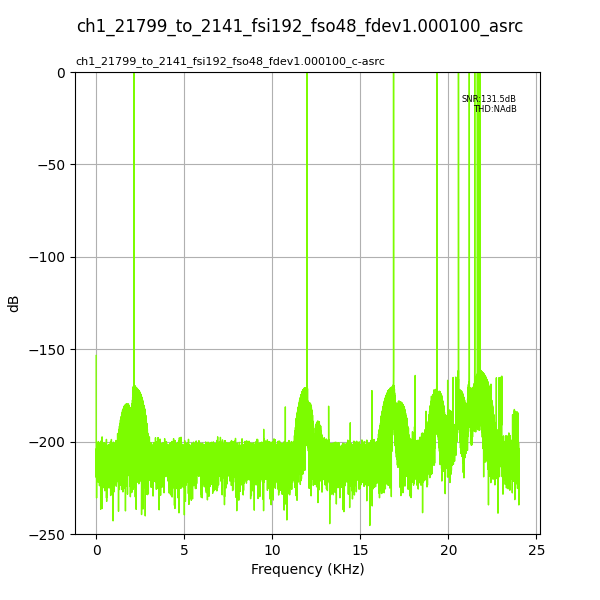
Fig. 186 Input Fs: 192,000Hz, Output Fs: 48,000Hz, Fs error: 1.000100, Results for: asrc#
Output Fs : 88,200Hz#
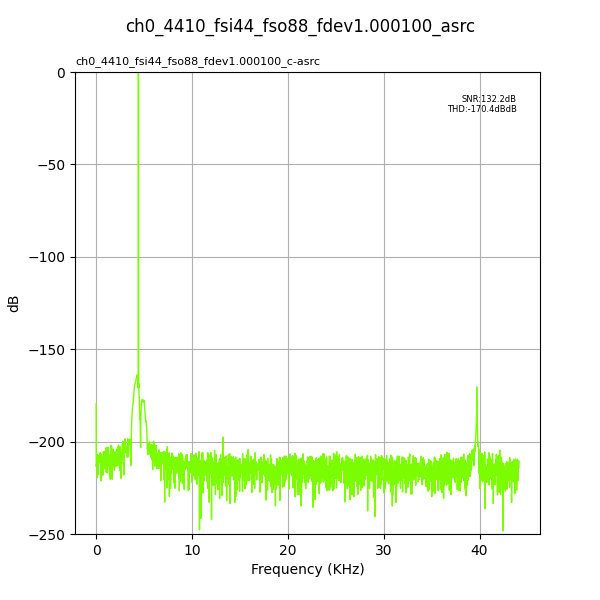
Fig. 187 Input Fs: 44,100Hz, Output Fs: 88,200Hz, Fs error: 1.000100, Results for: asrc#
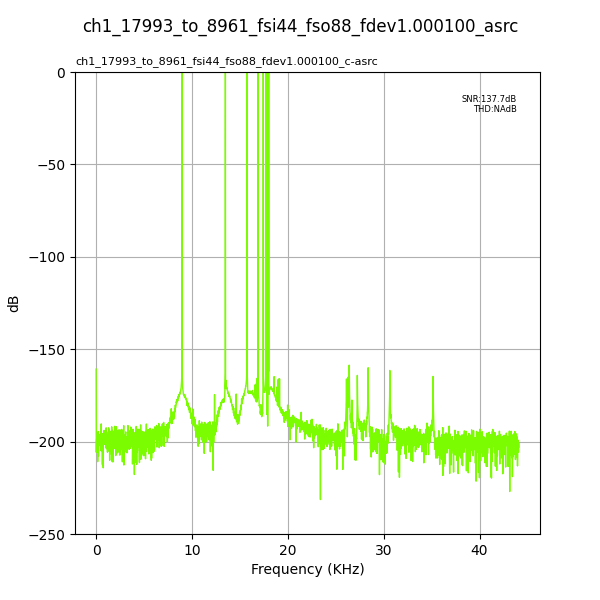
Fig. 188 Input Fs: 44,100Hz, Output Fs: 88,200Hz, Fs error: 1.000100, Results for: asrc#
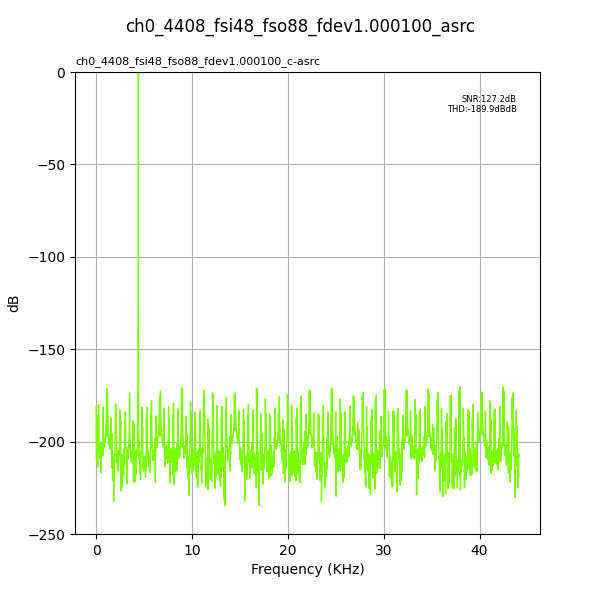
Fig. 189 Input Fs: 48,000Hz, Output Fs: 88,200Hz, Fs error: 1.000100, Results for: asrc#
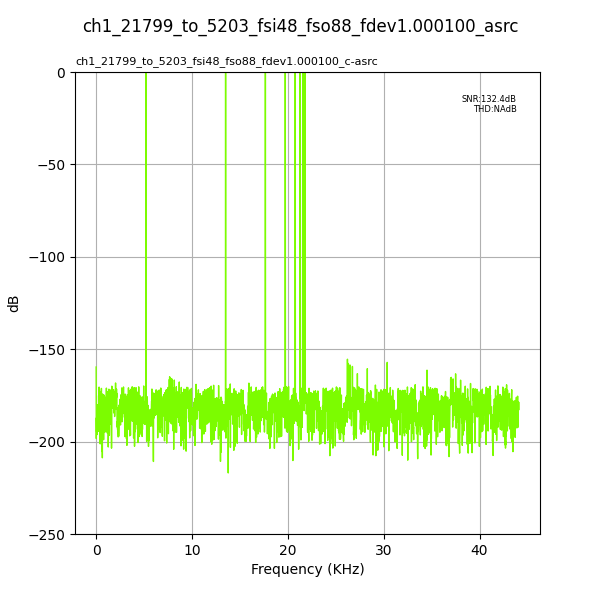
Fig. 190 Input Fs: 48,000Hz, Output Fs: 88,200Hz, Fs error: 1.000100, Results for: asrc#
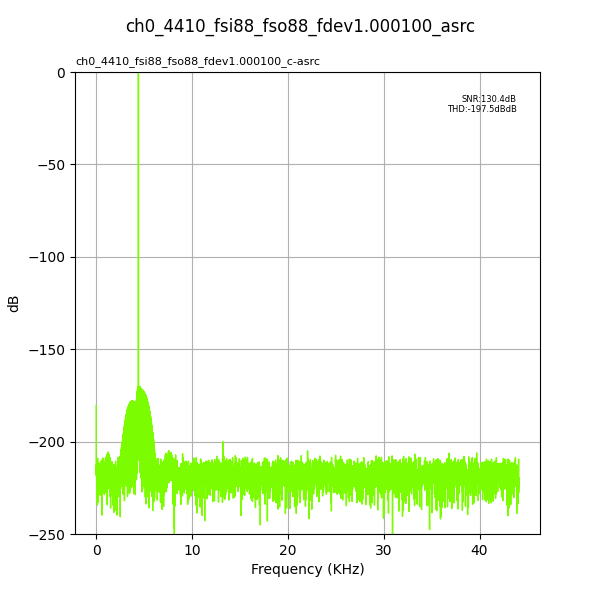
Fig. 191 Input Fs: 88,200Hz, Output Fs: 88,200Hz, Fs error: 1.000100, Results for: asrc#
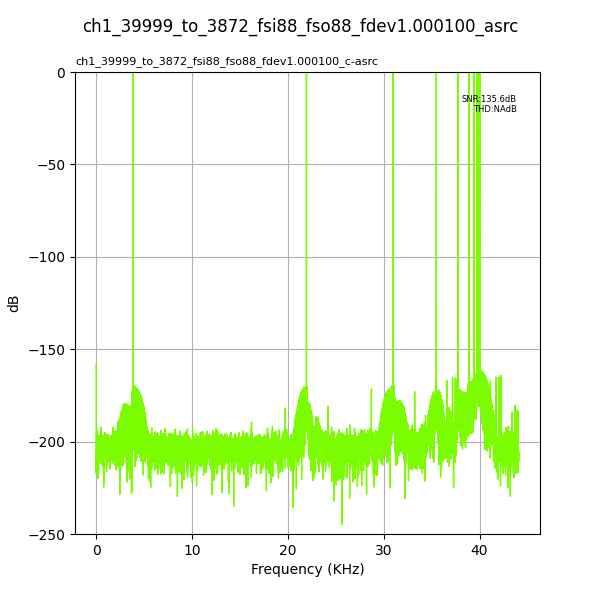
Fig. 192 Input Fs: 88,200Hz, Output Fs: 88,200Hz, Fs error: 1.000100, Results for: asrc#
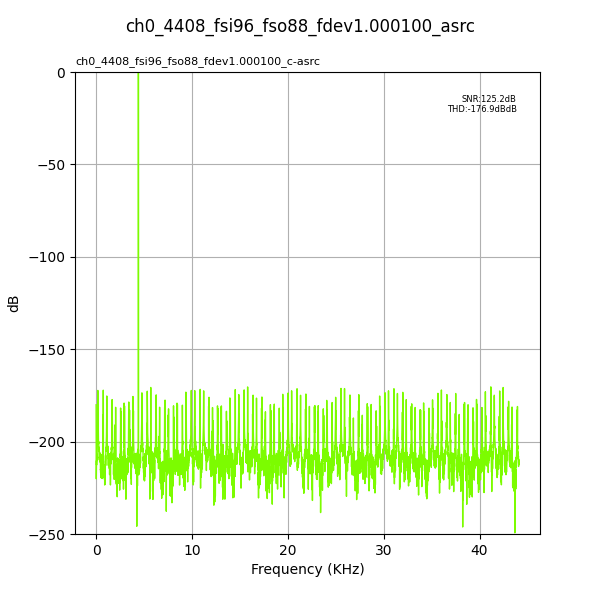
Fig. 193 Input Fs: 96,000Hz, Output Fs: 88,200Hz, Fs error: 1.000100, Results for: asrc#
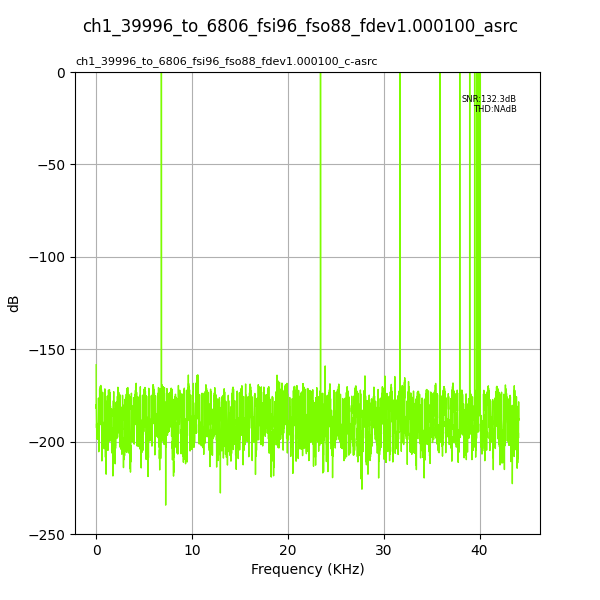
Fig. 194 Input Fs: 96,000Hz, Output Fs: 88,200Hz, Fs error: 1.000100, Results for: asrc#
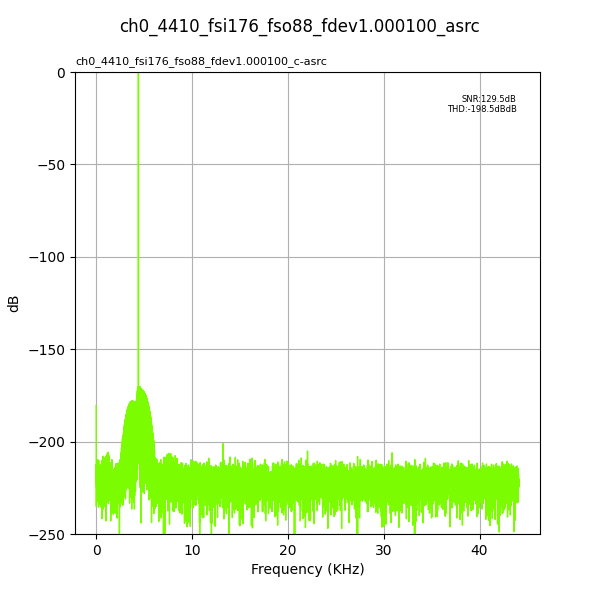
Fig. 195 Input Fs: 176,400Hz, Output Fs: 88,200Hz, Fs error: 1.000100, Results for: asrc#
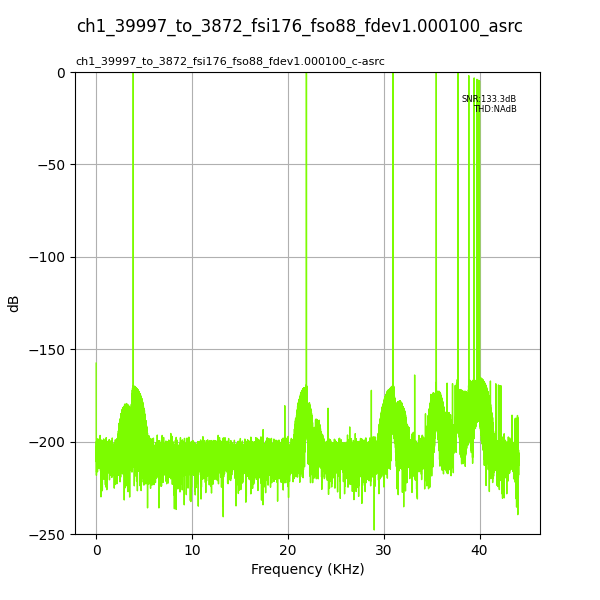
Fig. 196 Input Fs: 176,400Hz, Output Fs: 88,200Hz, Fs error: 1.000100, Results for: asrc#
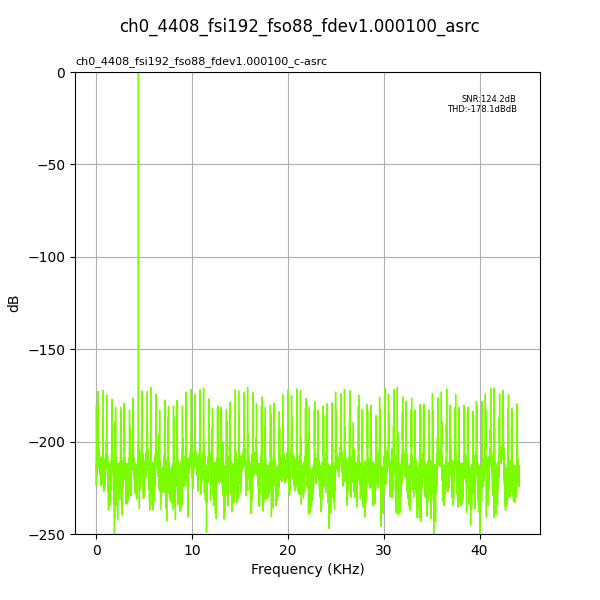
Fig. 197 Input Fs: 192,000Hz, Output Fs: 88,200Hz, Fs error: 1.000100, Results for: asrc#
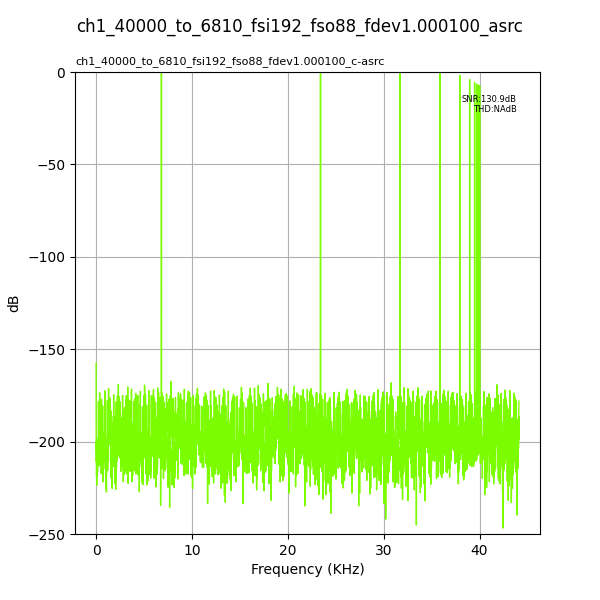
Fig. 198 Input Fs: 192,000Hz, Output Fs: 88,200Hz, Fs error: 1.000100, Results for: asrc#
Output Fs : 96,000Hz#
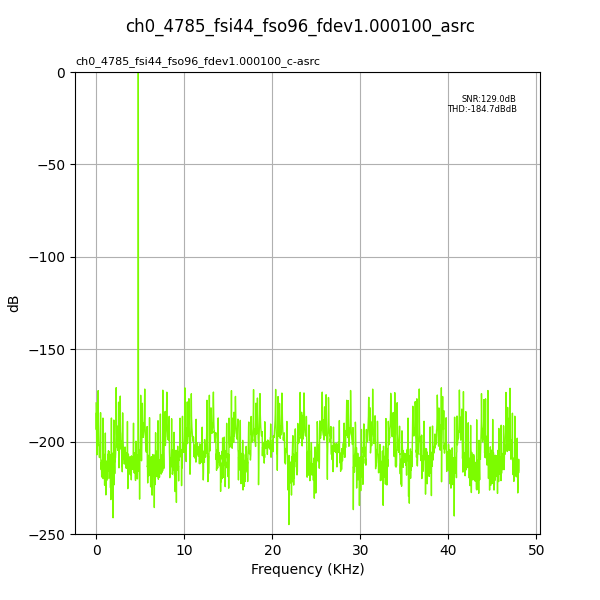
Fig. 199 Input Fs: 44,100Hz, Output Fs: 96,000Hz, Fs error: 1.000100, Results for: asrc#
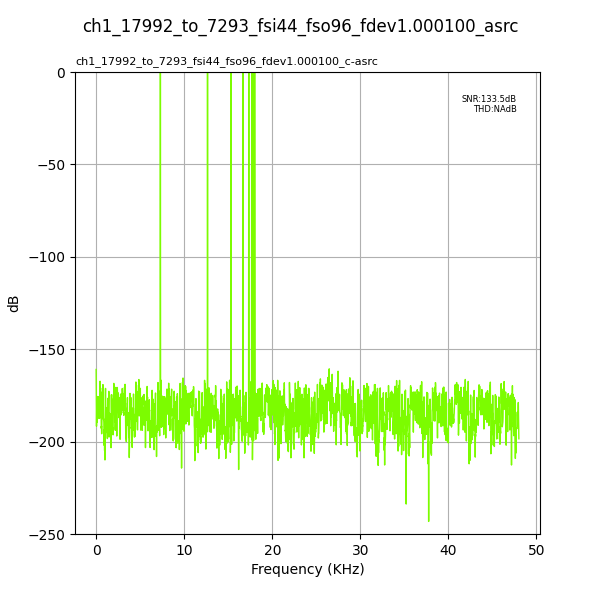
Fig. 200 Input Fs: 44,100Hz, Output Fs: 96,000Hz, Fs error: 1.000100, Results for: asrc#
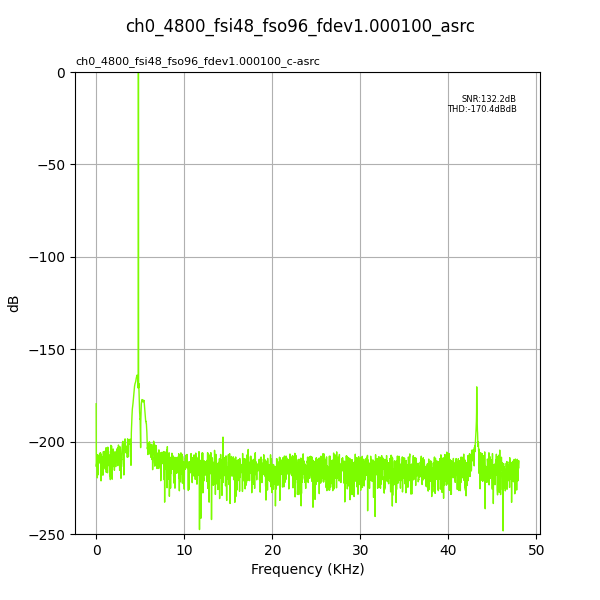
Fig. 201 Input Fs: 48,000Hz, Output Fs: 96,000Hz, Fs error: 1.000100, Results for: asrc#
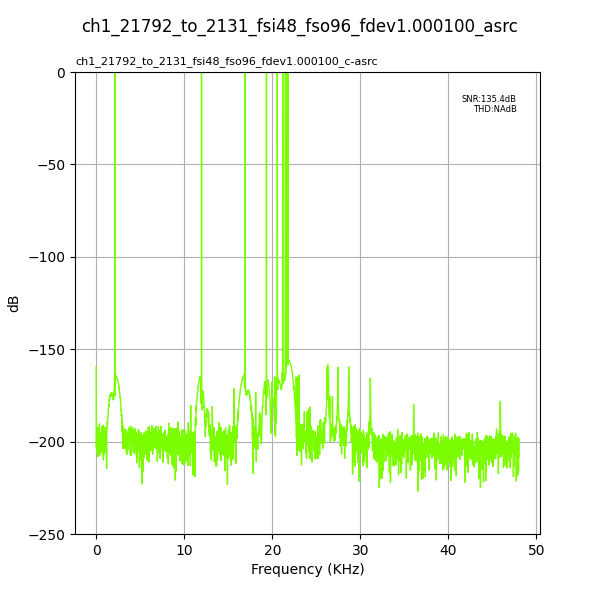
Fig. 202 Input Fs: 48,000Hz, Output Fs: 96,000Hz, Fs error: 1.000100, Results for: asrc#
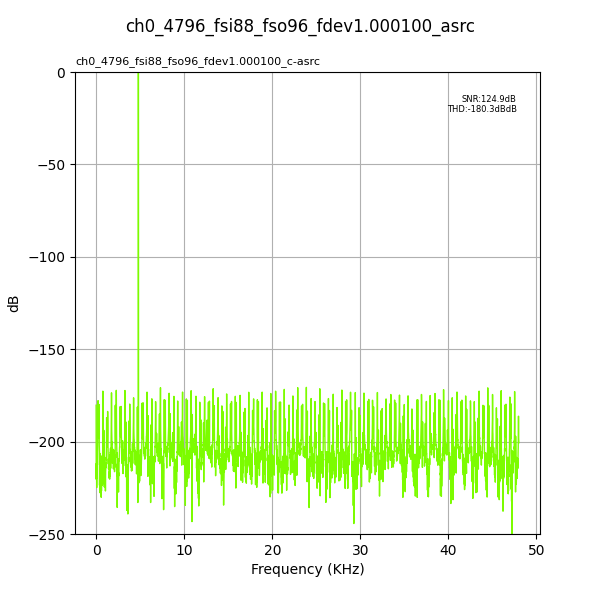
Fig. 203 Input Fs: 88,200Hz, Output Fs: 96,000Hz, Fs error: 1.000100, Results for: asrc#
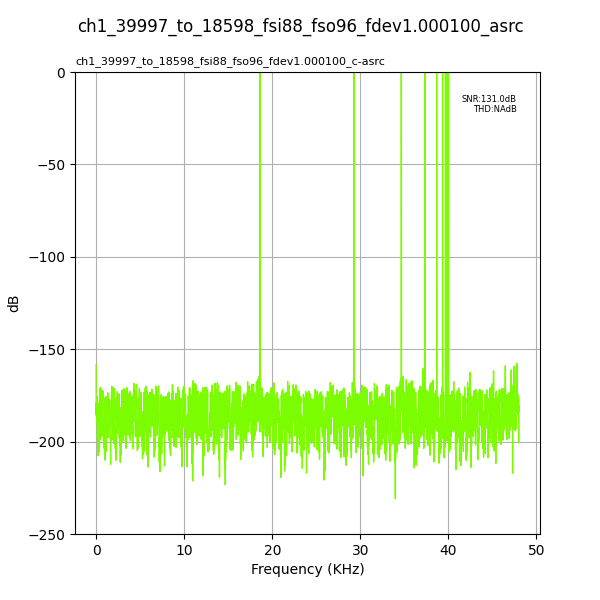
Fig. 204 Input Fs: 88,200Hz, Output Fs: 96,000Hz, Fs error: 1.000100, Results for: asrc#
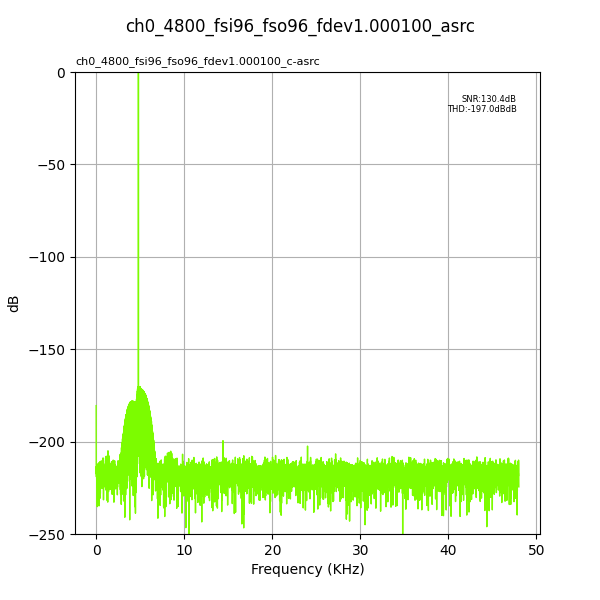
Fig. 205 Input Fs: 96,000Hz, Output Fs: 96,000Hz, Fs error: 1.000100, Results for: asrc#
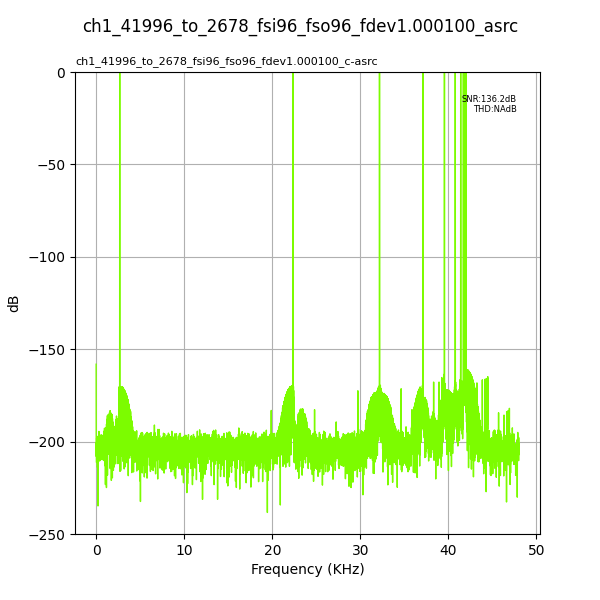
Fig. 206 Input Fs: 96,000Hz, Output Fs: 96,000Hz, Fs error: 1.000100, Results for: asrc#
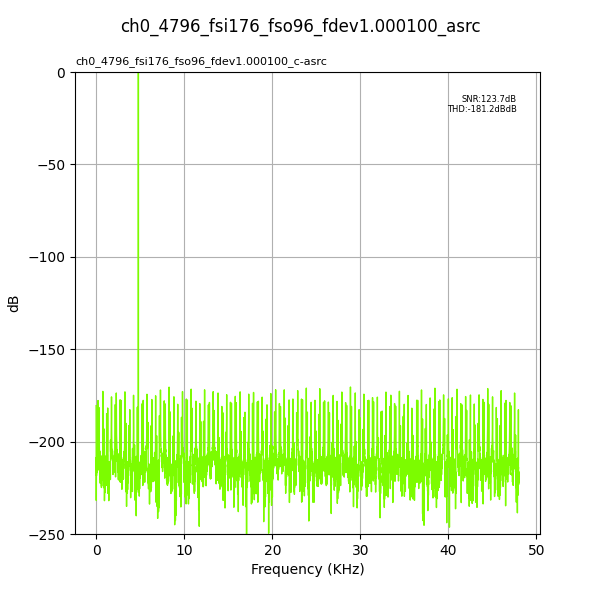
Fig. 207 Input Fs: 176,400Hz, Output Fs: 96,000Hz, Fs error: 1.000100, Results for: asrc#
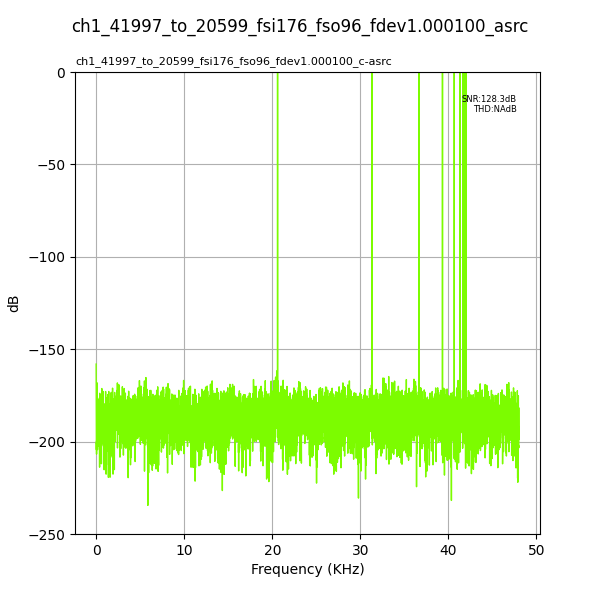
Fig. 208 Input Fs: 176,400Hz, Output Fs: 96,000Hz, Fs error: 1.000100, Results for: asrc#
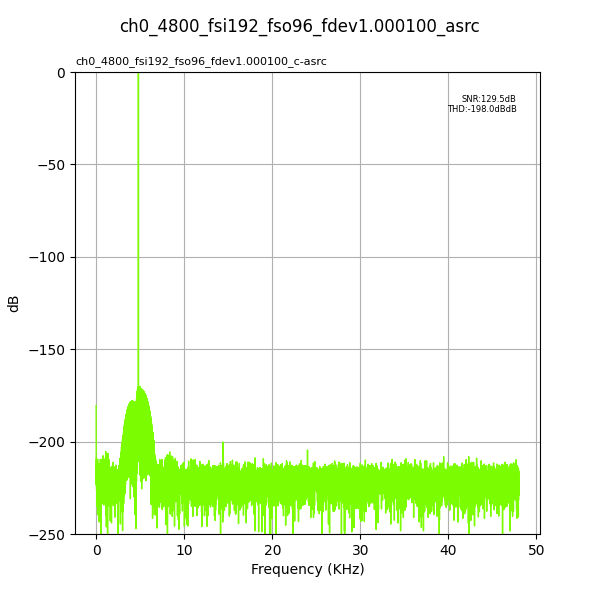
Fig. 209 Input Fs: 192,000Hz, Output Fs: 96,000Hz, Fs error: 1.000100, Results for: asrc#
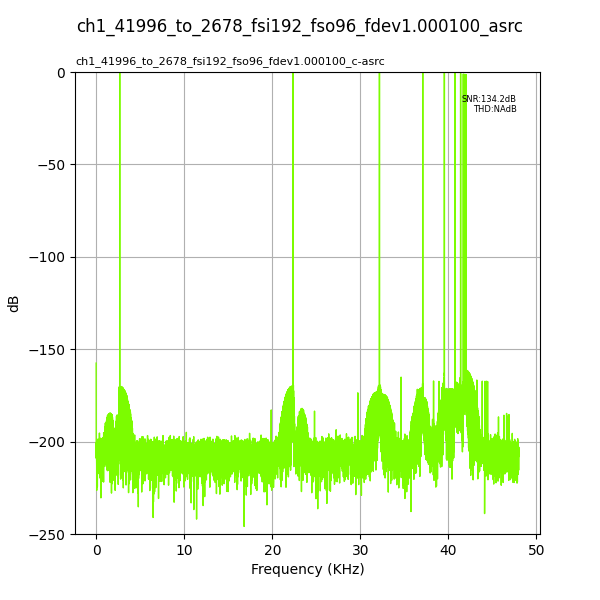
Fig. 210 Input Fs: 192,000Hz, Output Fs: 96,000Hz, Fs error: 1.000100, Results for: asrc#
Output Fs : 176,400Hz#
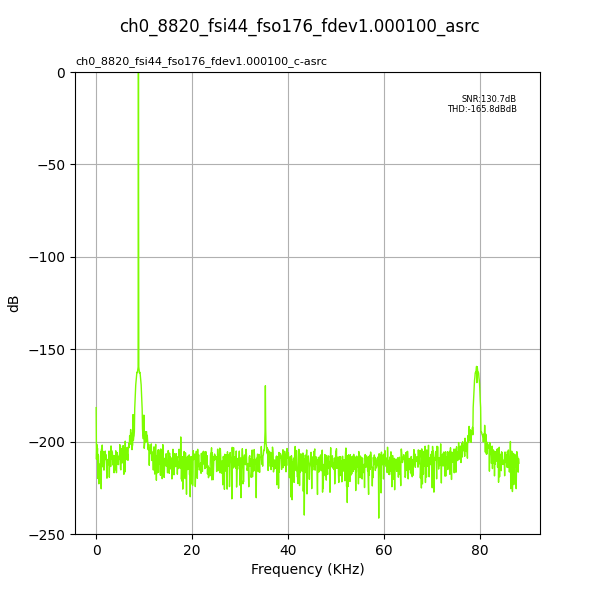
Fig. 211 Input Fs: 44,100Hz, Output Fs: 176,400Hz, Fs error: 1.000100, Results for: asrc#
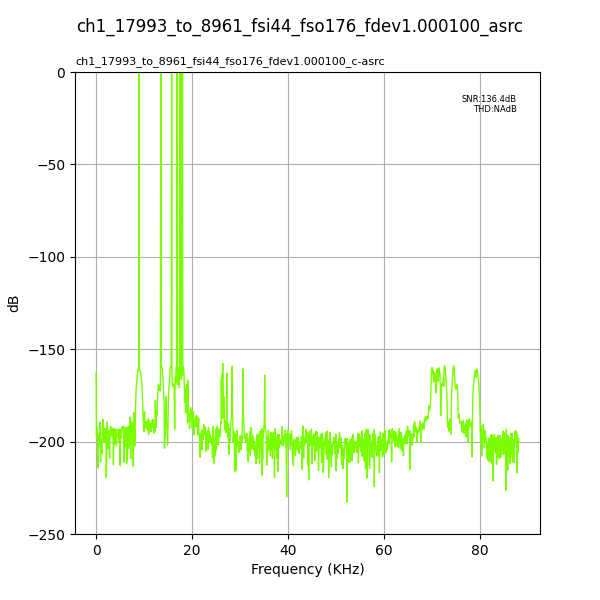
Fig. 212 Input Fs: 44,100Hz, Output Fs: 176,400Hz, Fs error: 1.000100, Results for: asrc#
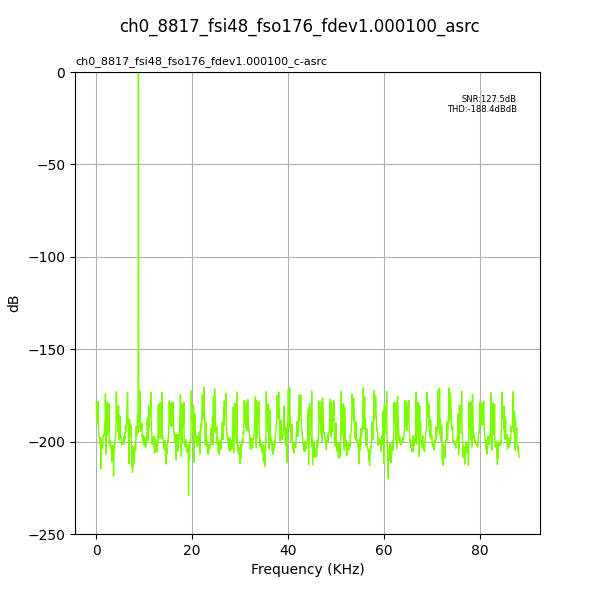
Fig. 213 Input Fs: 48,000Hz, Output Fs: 176,400Hz, Fs error: 1.000100, Results for: asrc#
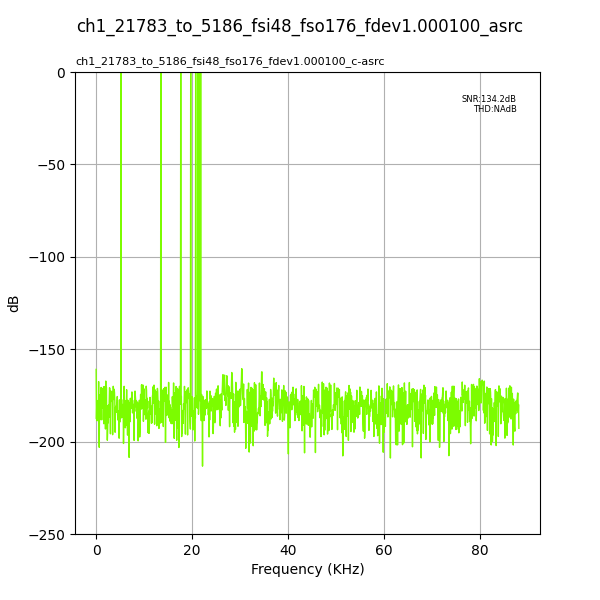
Fig. 214 Input Fs: 48,000Hz, Output Fs: 176,400Hz, Fs error: 1.000100, Results for: asrc#
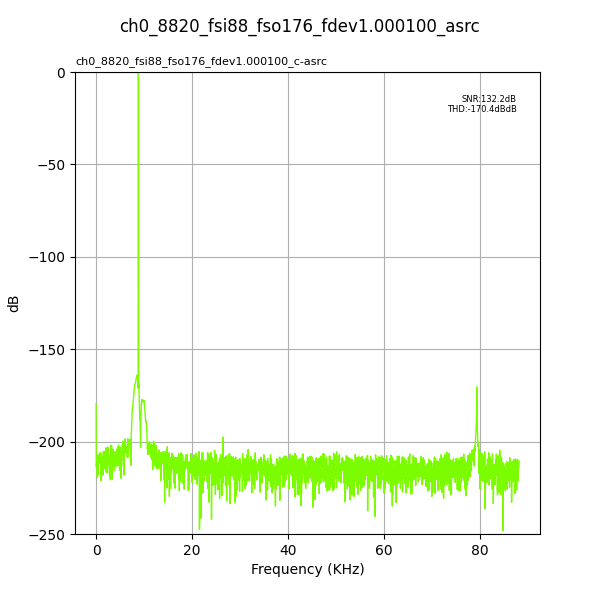
Fig. 215 Input Fs: 88,200Hz, Output Fs: 176,400Hz, Fs error: 1.000100, Results for: asrc#
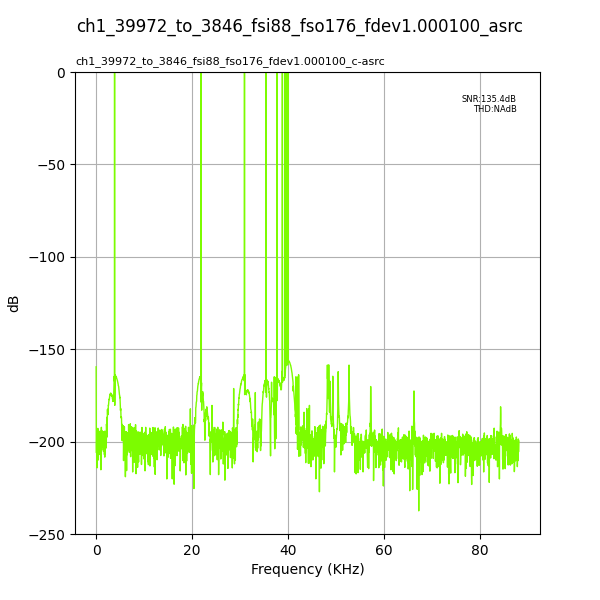
Fig. 216 Input Fs: 88,200Hz, Output Fs: 176,400Hz, Fs error: 1.000100, Results for: asrc#
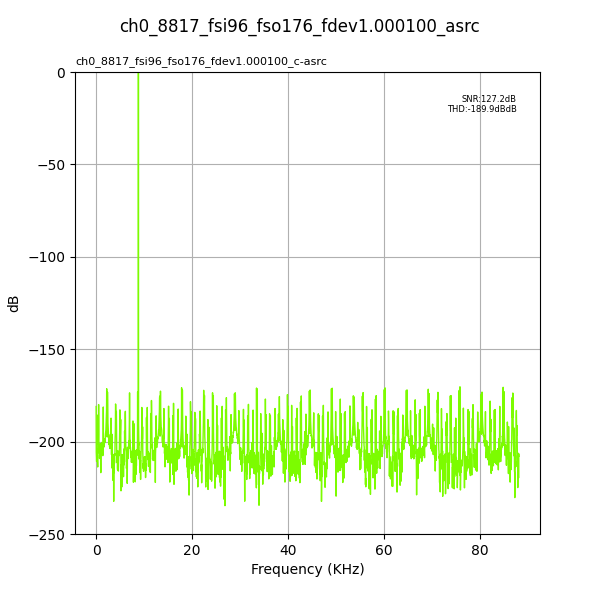
Fig. 217 Input Fs: 96,000Hz, Output Fs: 176,400Hz, Fs error: 1.000100, Results for: asrc#
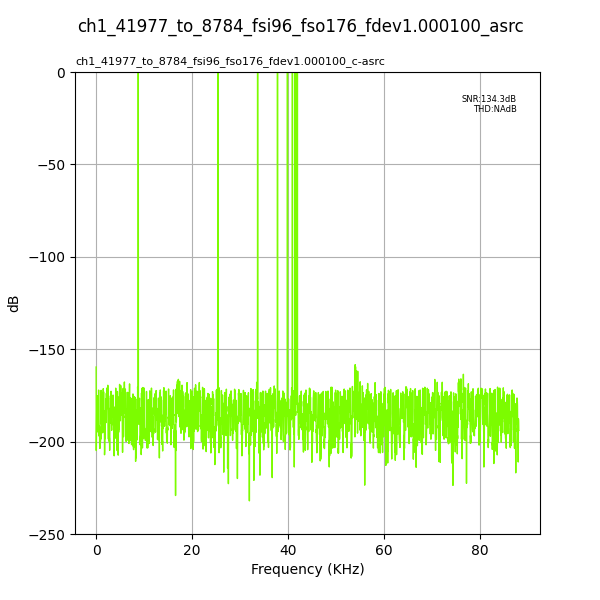
Fig. 218 Input Fs: 96,000Hz, Output Fs: 176,400Hz, Fs error: 1.000100, Results for: asrc#
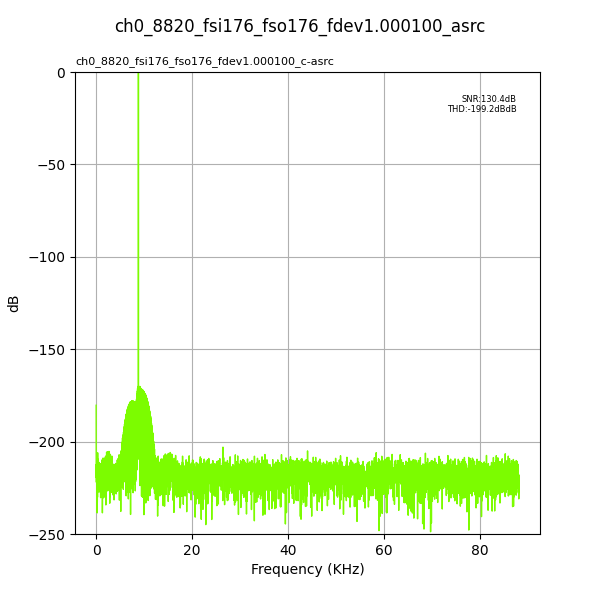
Fig. 219 Input Fs: 176,400Hz, Output Fs: 176,400Hz, Fs error: 1.000100, Results for: asrc#
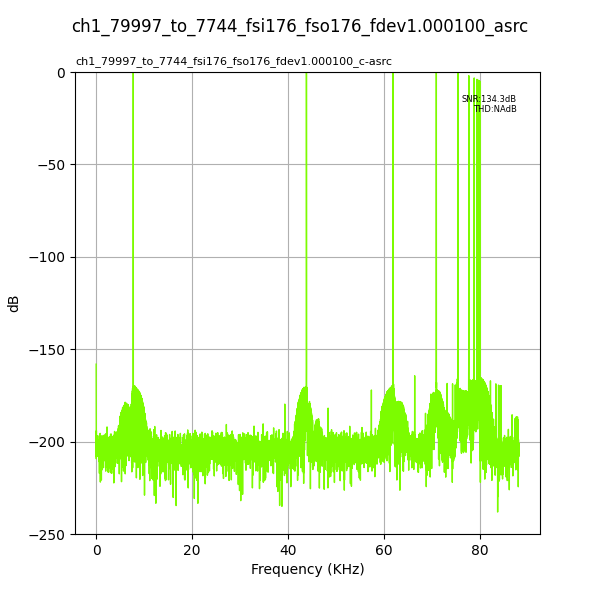
Fig. 220 Input Fs: 176,400Hz, Output Fs: 176,400Hz, Fs error: 1.000100, Results for: asrc#
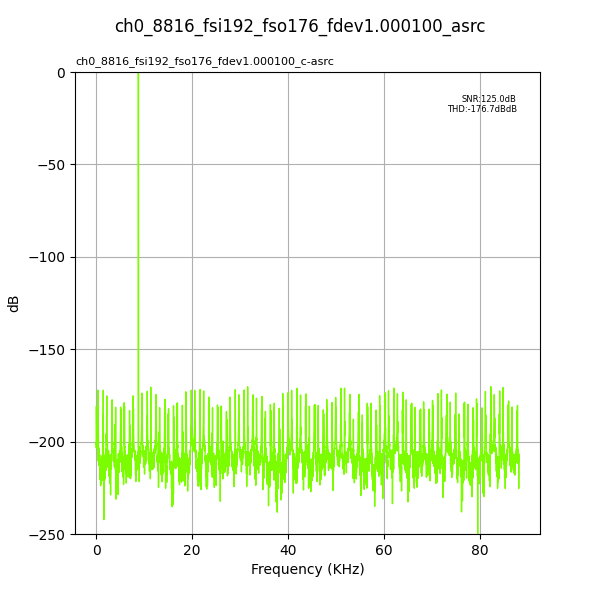
Fig. 221 Input Fs: 192,000Hz, Output Fs: 176,400Hz, Fs error: 1.000100, Results for: asrc#
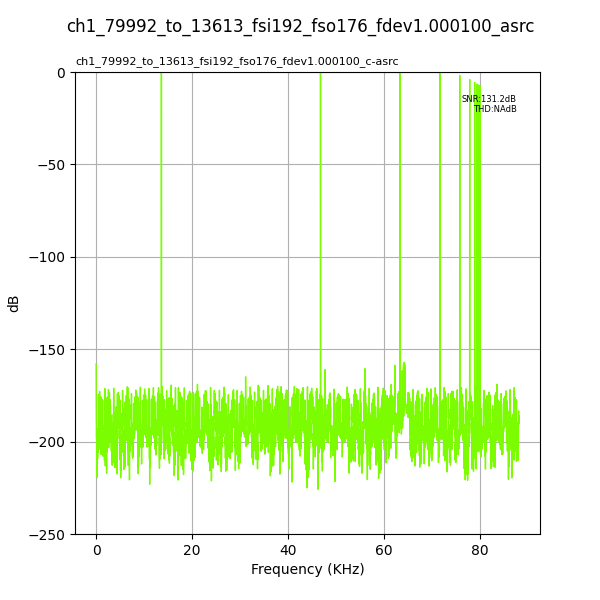
Fig. 222 Input Fs: 192,000Hz, Output Fs: 176,400Hz, Fs error: 1.000100, Results for: asrc#
Output Fs : 192,000Hz#
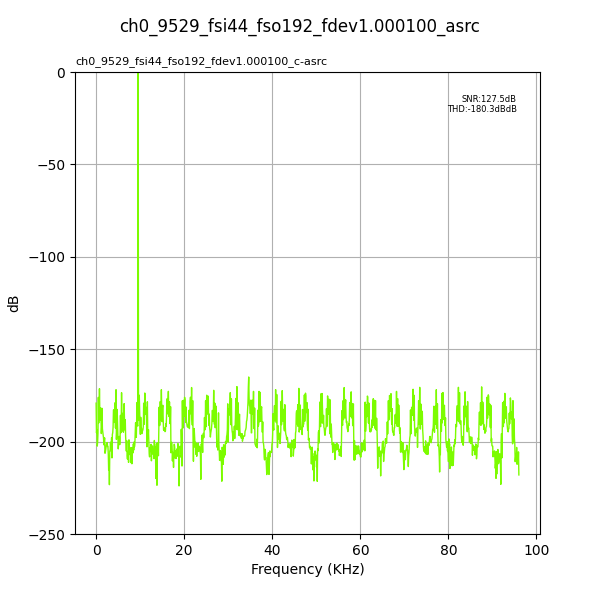
Fig. 223 Input Fs: 44,100Hz, Output Fs: 192,000Hz, Fs error: 1.000100, Results for: asrc#
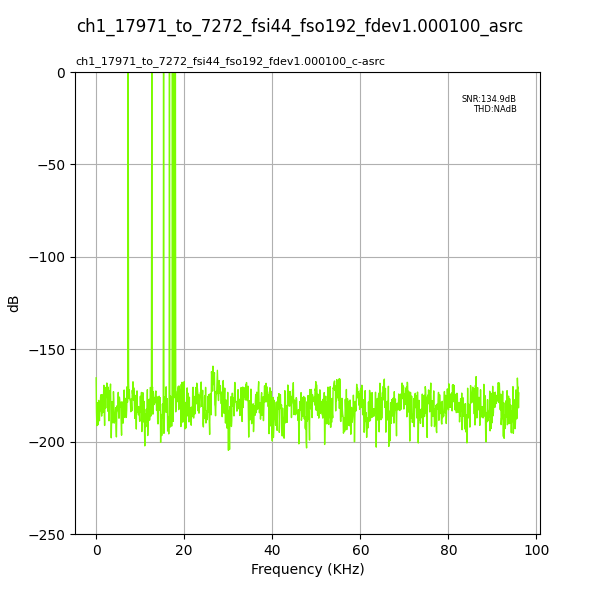
Fig. 224 Input Fs: 44,100Hz, Output Fs: 192,000Hz, Fs error: 1.000100, Results for: asrc#
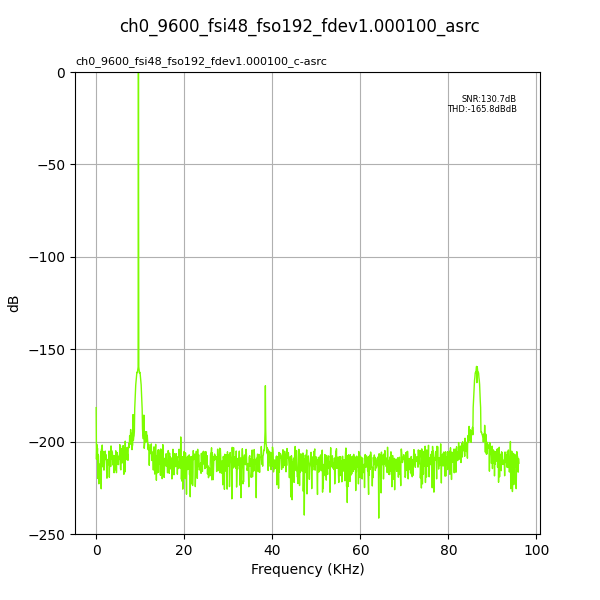
Fig. 225 Input Fs: 48,000Hz, Output Fs: 192,000Hz, Fs error: 1.000100, Results for: asrc#
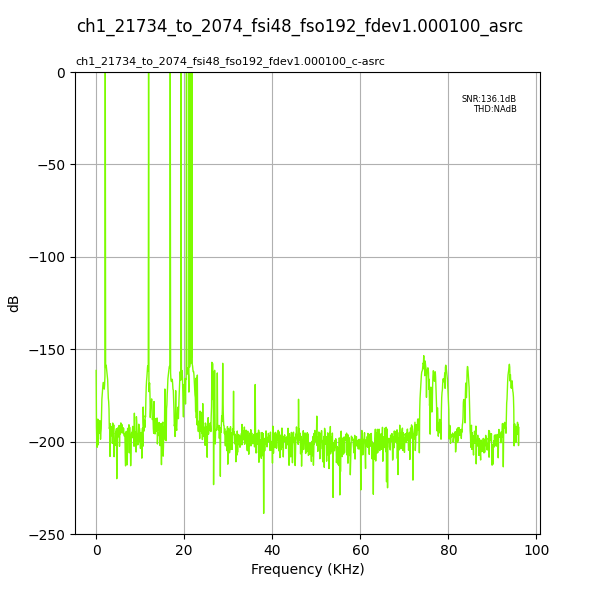
Fig. 226 Input Fs: 48,000Hz, Output Fs: 192,000Hz, Fs error: 1.000100, Results for: asrc#
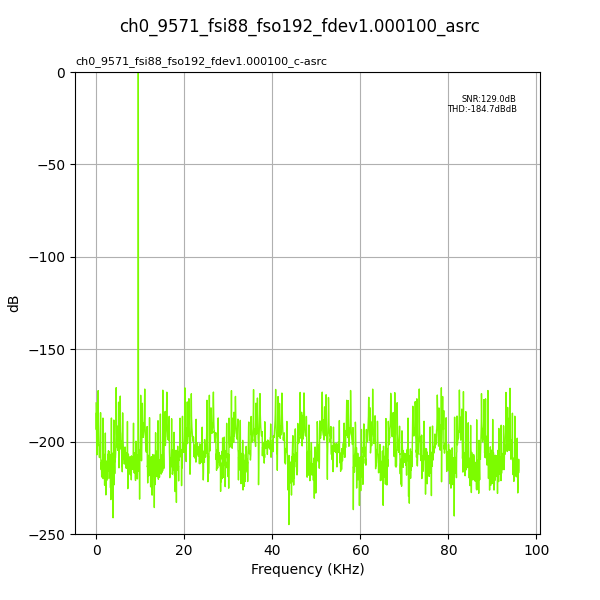
Fig. 227 Input Fs: 88,200Hz, Output Fs: 192,000Hz, Fs error: 1.000100, Results for: asrc#
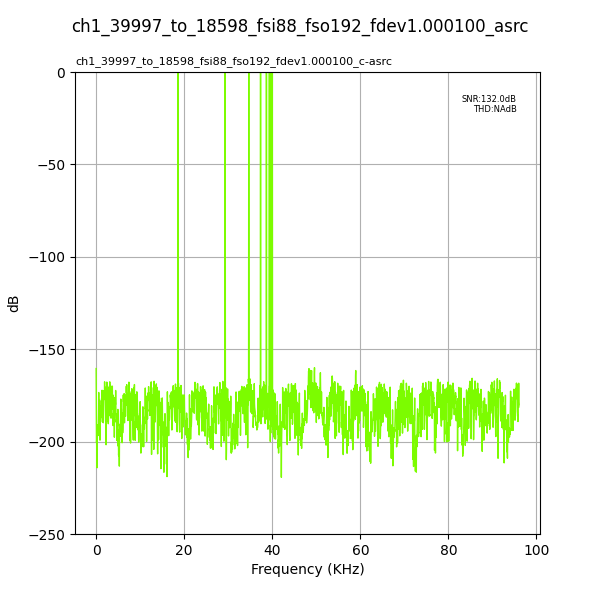
Fig. 228 Input Fs: 88,200Hz, Output Fs: 192,000Hz, Fs error: 1.000100, Results for: asrc#
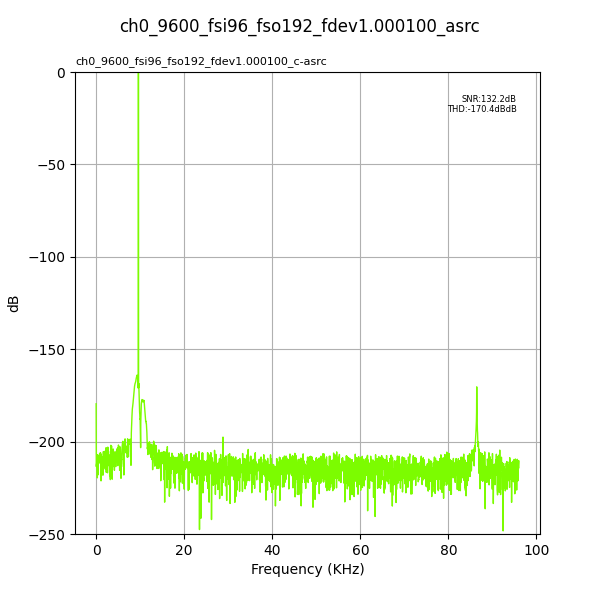
Fig. 229 Input Fs: 96,000Hz, Output Fs: 192,000Hz, Fs error: 1.000100, Results for: asrc#
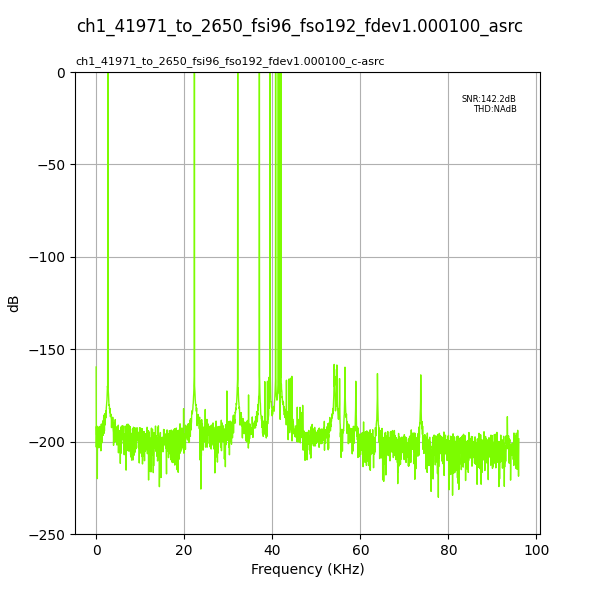
Fig. 230 Input Fs: 96,000Hz, Output Fs: 192,000Hz, Fs error: 1.000100, Results for: asrc#
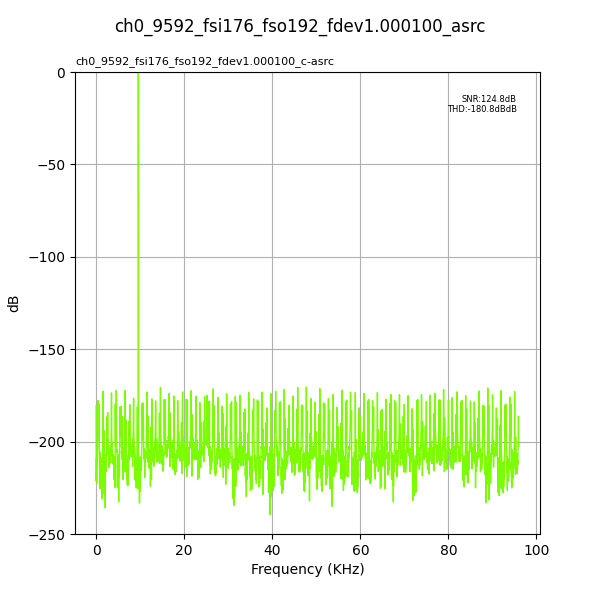
Fig. 231 Input Fs: 176,400Hz, Output Fs: 192,000Hz, Fs error: 1.000100, Results for: asrc#
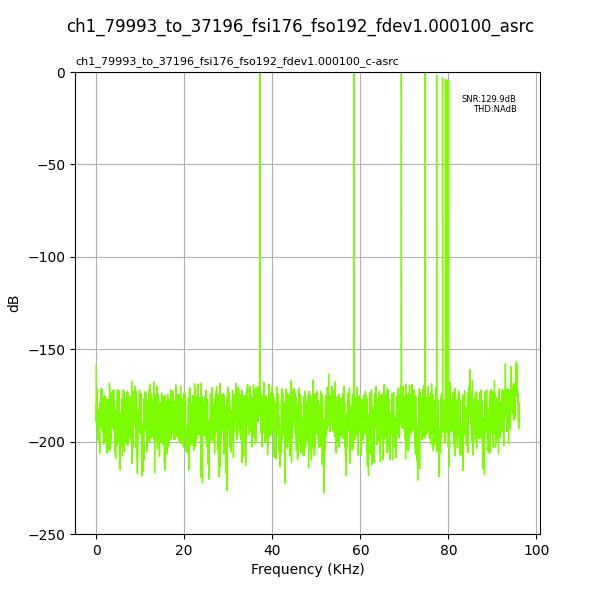
Fig. 232 Input Fs: 176,400Hz, Output Fs: 192,000Hz, Fs error: 1.000100, Results for: asrc#
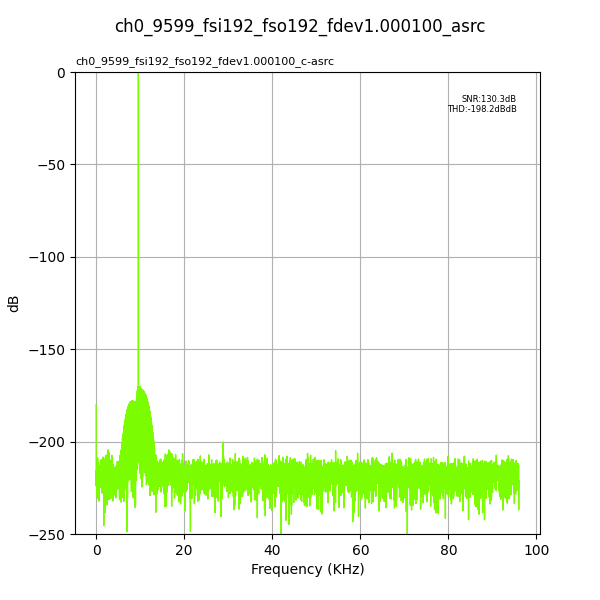
Fig. 233 Input Fs: 192,000Hz, Output Fs: 192,000Hz, Fs error: 1.000100, Results for: asrc#
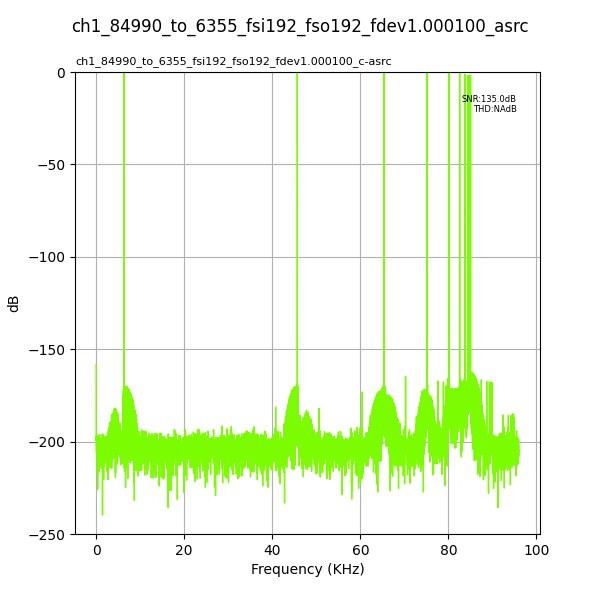
Fig. 234 Input Fs: 192,000Hz, Output Fs: 192,000Hz, Fs error: 1.000100, Results for: asrc#